Could the Fed drive the economy into a ditch?
US Dollar: Jun '23 USD is Down at 101.895.
Energies: May '23 Crude is Down at 70.14.
Financials: The Jun '23 30 Year T-Bond is Up 12 ticks and trading at 131.11.
Indices: The Mar '23 S&P 500 emini ES contract is 21 ticks Lower and trading at 4030.50.
Gold: The Apr'23 Gold contract is trading Up at 1981.10. Gold is 311 ticks Higher than its close.
Initial conclusion
This is not a correlated market. The dollar is Down, and Crude is Down which is not normal, and the 30 Year T-Bond is trading Higher. The Financials should always correlate with the US dollar such that if the dollar is Higher, then the bonds should follow and vice-versa. The S&P is Lower, and Crude is trading Lower which is not correlated. Gold is trading Higher which is correlated with the US dollar trading Down. I tend to believe that Gold has an inverse relationship with the US Dollar as when the US Dollar is down, Gold tends to rise in value and vice-versa. Think of it as a seesaw, when one is up the other should be down. I point this out to you to make you aware that when we don't have a correlated market, it means something is wrong. As traders you need to be aware of this and proceed with your eyes wide open. At the present time Asia is trading Higher with the exception of the Nikkei and Singapore exchanges. Currently all of Europe is trading Lower.
Possible challenges to traders today
-
Unemployment Claims is out at 8:30 AM EST. This is Major.
-
Current Account is out at 8:30 AM EST. This is Major.
-
New Home Sales is out at 10 AM EST. This is Major.
-
Natural Gas Storage is out at 10:30 AM EST. This is Major.
Treasuries
Traders, please note that we've changed the Bond instrument from the 30 year (ZB) to the 10 year (ZN). They work exactly the same.
We've elected to switch gears a bit and show correlation between the 10-year bond (ZN) and the S&P futures contract. The S&P contract is the Standard and Poor's, and the purpose is to show reverse correlation between the two instruments. Remember it's likened to a seesaw, when up goes up the other should go down and vice versa.
Yesterday the ZN hit a Low at around 10:30 AM EST but at the same time the S&P was going Lower. If you look at the charts below ZN gave a signal at around 10:30 AM and the S&P gave a signal at around the same time. Look at the charts below and you'll see a pattern for both assets. ZN hit a Low at around 10:30 AM and migrated Higher. These charts represent the newest version of MultiCharts and I've changed the timeframe to a 15-minute chart to display better. This represented a Long opportunity on the 10-year note, as a trader you could have netted about 60 plus ticks per contract on this trade. Each tick is worth $15.625. Please note: the front month for the ZN is now Jun '23. The S&P contract is also Jun' 23. I've changed the format to filled Candlesticks (not hollow) such that it may be more apparent and visible.
Charts courtesy of MultiCharts built on an AMP platform
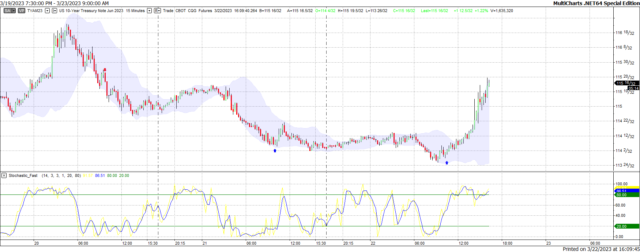
ZN - Jun 2023 - 3/22/23
-638151651242800422.png)
S&P - Jun 2023 - 3/22/23
Bias
Yesterday we gave the markets a Neutral bias as is was FOMC Day and the markets have never shown any sense of normalcy on that day. The markets veered to the Downside as the Dow dropped 530 points and the other indices lost ground as well. Today we aren't dealing with a correlated market and our bias is to the Upside.
Could this change? Of Course. Remember anything can happen in a volatile market.
Commentary
Yesterday as suggested the Federal Reserve raised the FFR (Federal Funds Rate) by 25 basis points to bring the total up to 5% even. Mind you this is what a bank pays the Fed to borrow funds, as consumers we will pay much more so the banks can profit off our need. The markets did not accept this news too well as the Dow dropped over 500 points by the time the closing bell hit. In a way we were lucky that they didn't raise by 50 basis points. Then the falloff would be more severe. Personally, I think it would have been better if the Fed had left the rates alone. This would have signaled a bottom to the markets and instead of falling, they would have veered higher. The Fed should be mindful of what they do because if they aren't careful, they could easily drive this economy into a ditch. If massive layoffs start happening, then consumer spending will dry up and the economy will be in a ditch. Today we have Unemployment Claims and New Home Sales. The New Home Sales number will be indicative of a strong economy. As in all things only time will tell.
Author

Nick Mastrandrea
Market Tea Leaves


