COT: Record Ownership Profile in Copper
-
Record positioning in S&P 500
-
Record positioning in Copper
-
Specs are still heavily long Wheat

52 Week Ownership Profile Extremes – Mexican Peso, S&P 500, Copper, Wheat, Rough Rice
13 Week Volume Highs – Silver, Soybean Oil, Wheat, Corn, Frozen OJ
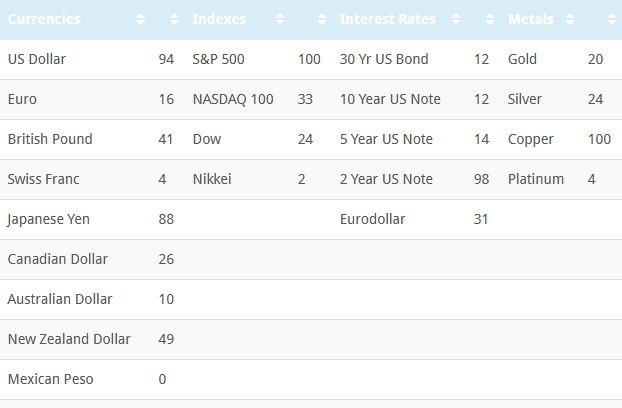
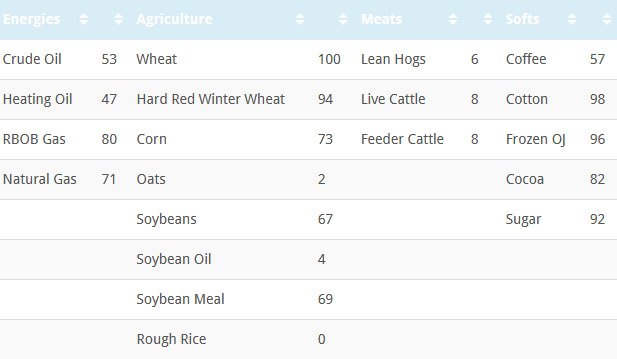
The COT Index is the difference between net speculative positioning and net commercial positioning measured over a 52 week percentile. A reading of 100 indicates that the difference in positioning is the greatest it has been in 52 weeks with speculators buying and commercials selling. A reading of 0 indicates that the difference in positioning is the greatest it has been in 52 weeks with speculators selling and commercials buying. Speculators tend to be on the wrong side at the turn and commercials the correct side.
Latest CFTC Release dated June 12th, 2018
Non Commercials (speculators) – Red
Commercials – Blue
Small Speculators – Black
COTDiff (COT Index) – Black
52 week Percentile (COT Diff) – Gray
S&P 500 CME Continuous Contract
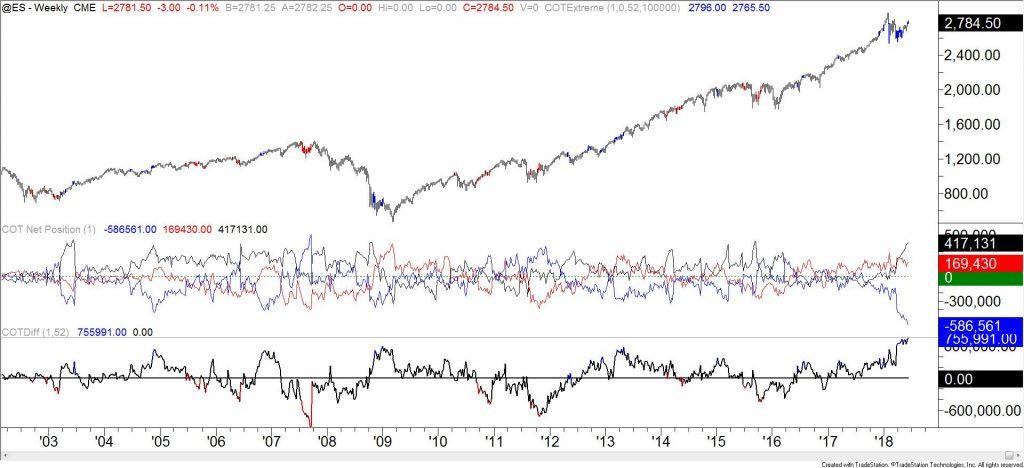
The ownership profile in the S&P 500 is at a record. Simply, the extreme speculative long position and extreme commercial short position warns of a price top.
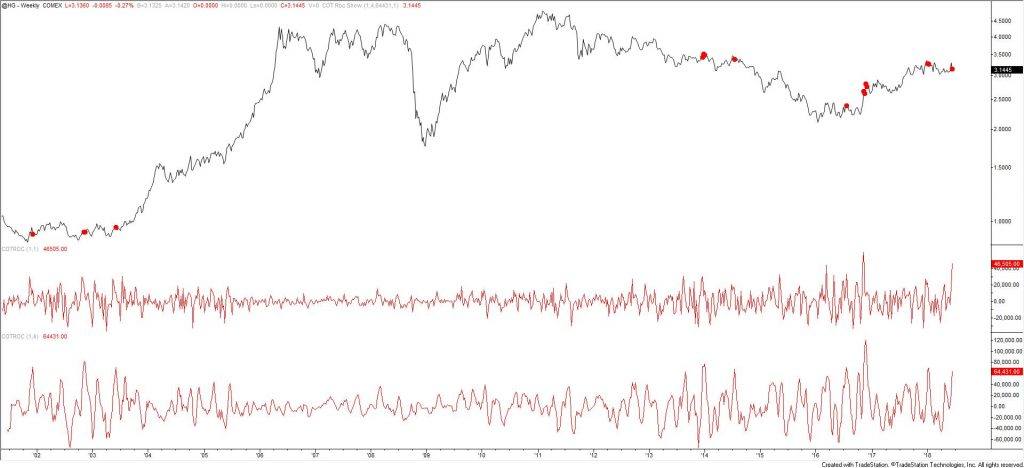
Copper COMEX Continuous Contract
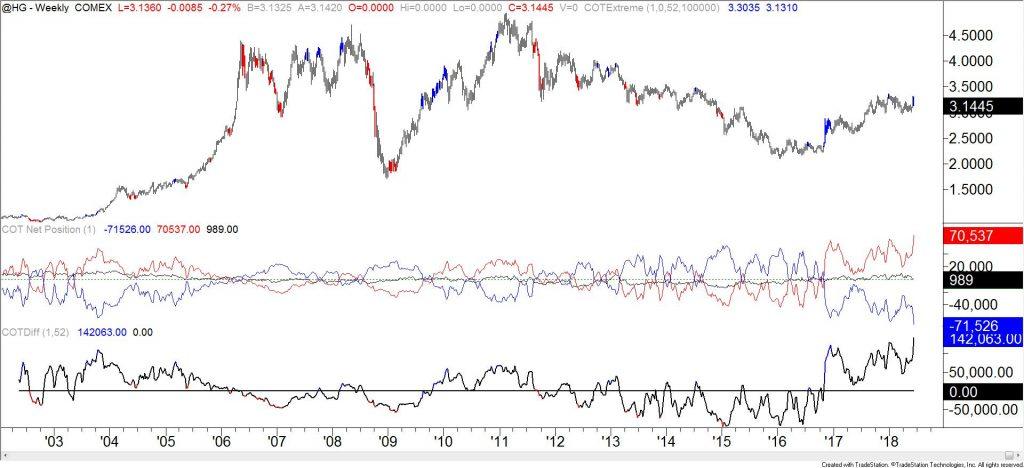
The ownership profile in Copper is at a record. Simply, the extreme speculative long position and extreme commercial short position warns of a price top. Also, the most recent data reveals extreme 1 and 4 week buying by speculators (see below chart). Extreme 1 week buying can indicate capitulation.
Copper COMEX Continuous Contract
Author

Jamie Saettele, CMT
Scandinavian Capital Markets
Jamie Saettele is Senior Technical Strategist at Scandinavian Capital Markets, a premier broker offering services to institutional clients, fund managers and professional traders around the world.


