COT: Precious Metals Positioning is the Most Extreme Ever
-
Record ownership profile in gold
-
Record ownership profile in silver
-
Record ownership profile in platinum

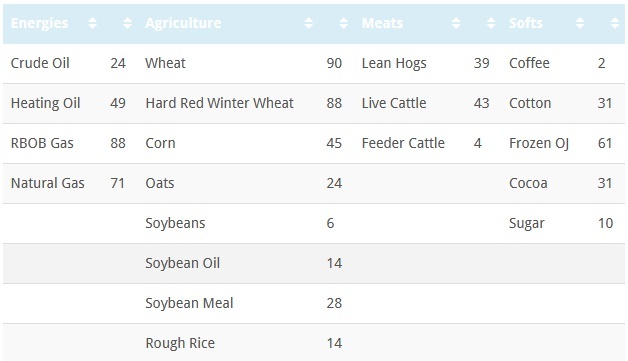
52 Week Ownership Profile Extremes – Gold, Silver, Copper, Platinum
13 Week Volume Highs – Australian Dollar, Swiss Franc
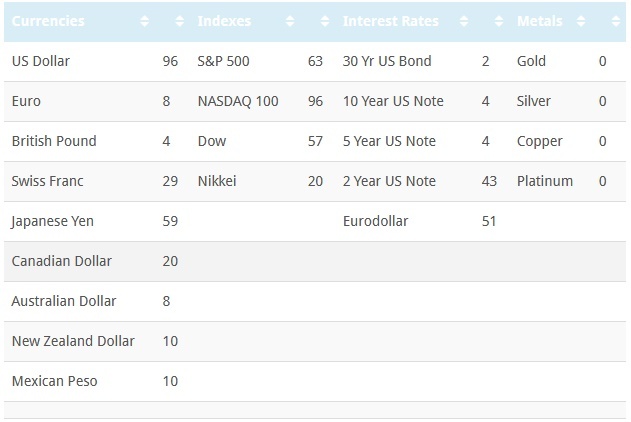
The COT Index is the difference between net speculative positioning and net commercial positioning measured over a 52 week percentile. A reading of 100 indicates that the difference in positioning is the greatest it has been in 52 weeks with speculators buying and commercials selling. A reading of 0 indicates that the difference in positioning is the greatest it has been in 52 weeks with speculators selling and commercials buying. Speculators tend to be on the wrong side at the turn and commercials the correct side.
Latest CFTC Release dated September 4th, 2018
Non Commercials (speculators) – Red
Commercials – Blue
Small Speculators – Black
COTDiff (COT Index) – Black
52 week Percentile (COT Diff) – Gray
Gold COMEX Continuous Contract
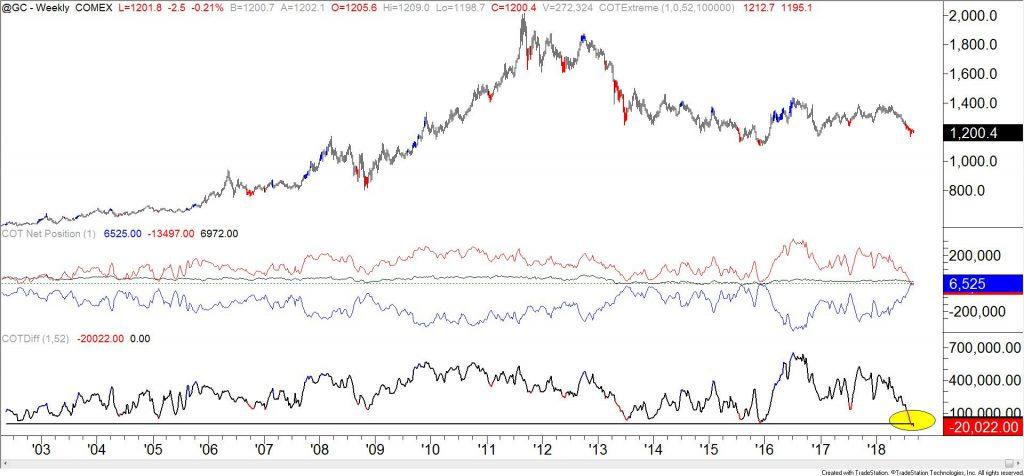
The ownership profile in Gold is at a record. In fact, the only other period in which the net speculative position was short was for several weeks in August, November, and December 2001.
Silver COMEX Continuous Contract
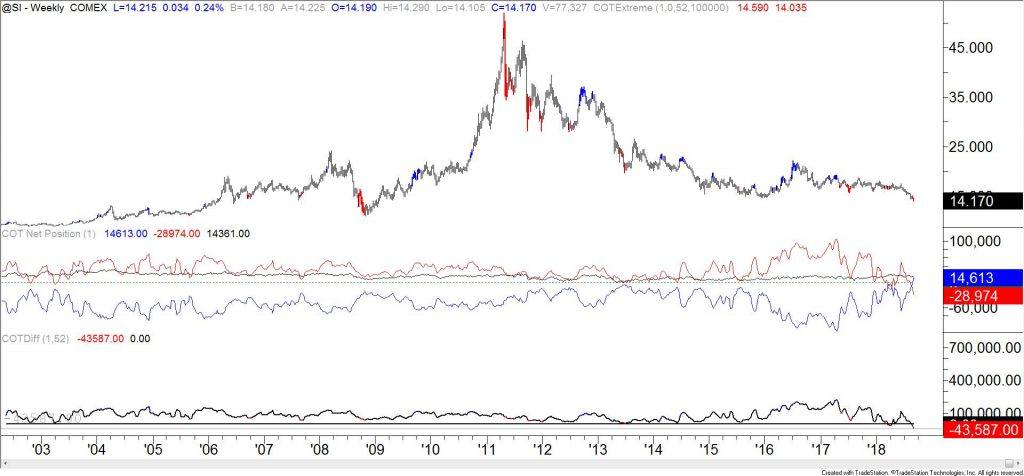
The ownership profile in Silver is at a record. The extreme speculative short position and extreme commercial long position warns of a price low.
Platinum COMEX Continuous Contract
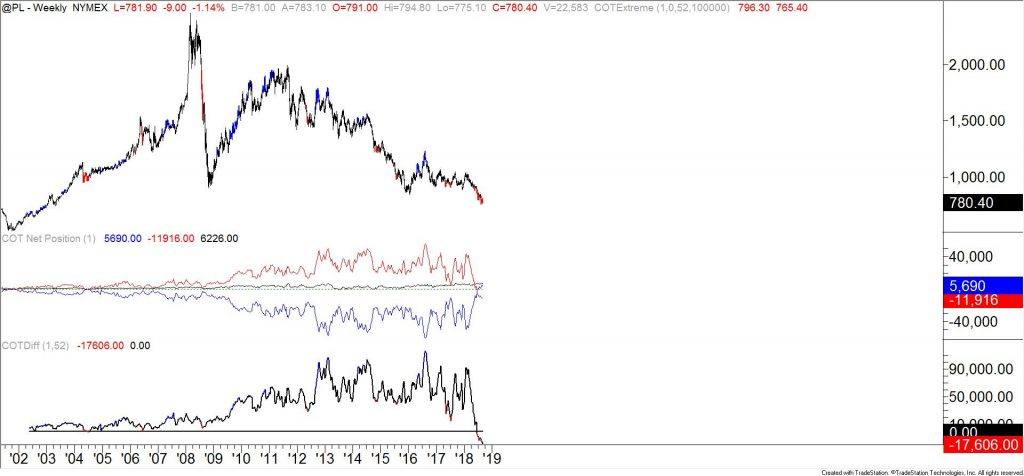
The ownership profile in Platinum is at a record. The extreme speculative short position and extreme commercial long position warns of a price low.
Author

Jamie Saettele, CMT
Scandinavian Capital Markets
Jamie Saettele is Senior Technical Strategist at Scandinavian Capital Markets, a premier broker offering services to institutional clients, fund managers and professional traders around the world.


