Coronavirus figures: Why traders should ignore Mondays and Tuesdays, focus on other stats
- Delays in administrative work over the weaken may create false optimism on Mondays.
- Catch-up counting on Tuesdays tends to trigger a disappointing surge in cases.
- Seven-day rolling averages serve as a better guide to cases.

"Tell me why I don't like Mondays" – the 1980s Boomtown Rats' song is the opposite of what those following COVID-19 statistics see. Figures on Mondays tend to show a drop in cases and deaths in various places in the world. such as Spain, and New York's figures all provide hope, contributing to a massive stock market rally on Monday, April 6.
However, the picture changed on Tuesday, April 7, when Spain broke the streak of the falling number of mortalities and New York reported its deadliest day on record. Markets came off their lows in response. The UK figures also disappointed, adding to the gloomy market mood as Prime Minister Boris Johnson is in intensive care.
However, the figures on the first two days of the week may be misleading. Statistics published on Monday refer to Sunday when some of the administrative teams in hospitals are off for the weekend. Some of the figures are not transmitted to central authorities in time to be reported. That artificially lowers the number of cases.
When these workers return to work on Mondays they clear their desks and send updated stats to the national or regional health officials, thus pushing infections and deaths up in reports published on Tuesdays.
Seven-day rolling averages
Some leading indicators have become stale in coronavirus times. The fast pace of events has made the Non-Farm Payrolls publication – published just days after the month ends – to somewhat lagging. The higher-frequency weekly jobless claims are more relevant.
However, with COVID-19 stats, the daily updates provide a significant amount of noise. Seven-day rolling averages clear up the ups and downs of weekends and provide a clever picture.
The Financial Times' seven-day rolling moving average is providing a clearer picture, distinguishing in April 7's case between the fall in Spanish and Italian deaths and the rapid rise in US and UK mortalities.
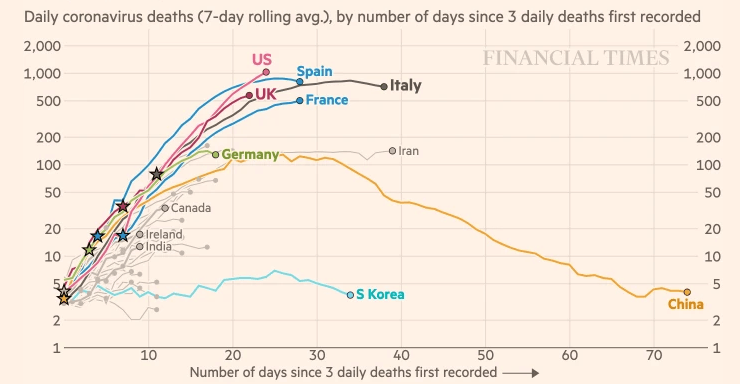
Source: FT
When things calm down, the Non-Farm Payrolls will likely return to its leading position while weekly jobless claims will probably be considered as noise once again – with investors eyeing the four-week moving average.
The exit in some countries is already on the horizon.
See Coronavirus Exit Strategy: Three critical factors to watch and how they impact currencies
Author

Yohay Elam
FXStreet
Yohay is in Forex since 2008 when he founded Forex Crunch, a blog crafted in his free time that turned into a fully-fledged currency website later sold to Finixio.


