Technical analysis: Will corn quotes continue to decline?
Corn technical analysis summary
Sell Stop։ Below 750
Stop Loss: Above 824
| Indicator | Indicator |
| RSI | Sell |
| MACD | Sell |
| MA(200) | Neutral |
| Fractals | Neutral |
| Parabolic SAR | Sell |
| Bollinger Bands | Neutral |
Corn chart analysis
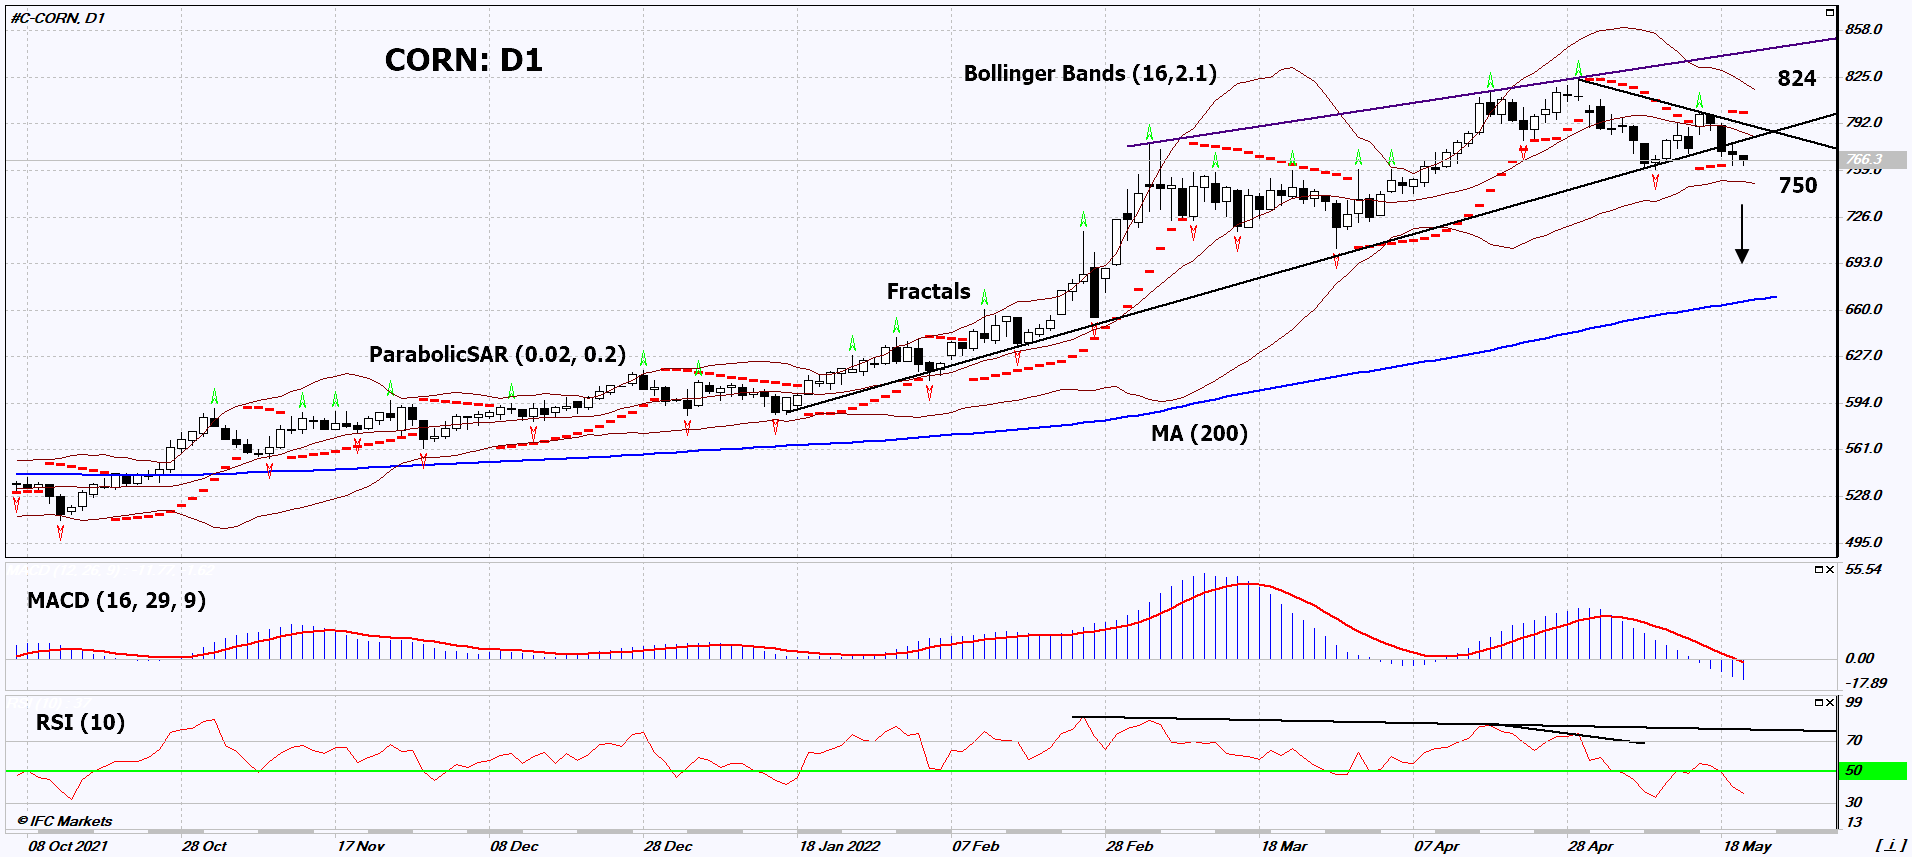
On the daily timeframe, CORN: D1 broke through the uptrend support line and exited the triangle down. A number of technical analysis indicators formed signals for further decline. We do not rule out a bearish movement if CORN: D1 drops below the last down fractal and the lower Bollinger band: 750. This level can be used as an entry point. The initial risk limit may be above the last 2 upper fractals, the 10-year high, the upper Bollinger band and the Parabolic signal: 824. After opening a pending order, we move the stop following the Bollinger and Parabolic signals to the next fractal high. Thus, we change the potential profit/loss ratio in our favor. The most cautious traders after making a trade can switch to a four-hour chart and set a stop loss, moving it in the direction of movement. If the price overcomes the stop level (824) without activating the order (750), it is recommended to delete the order: there are internal changes in the market that were not taken into account.
Fundamental analysis of commodities - Corn
The global corn crop may increase. Will CORN quotes continue to decline?
The International Grains Council expects a 7.3% increase in global corn production in the 2021/2022 growing season compared to the 2020/2021 season. Thus, it can reach 1214 million tons. World consumption is estimated at 1207 million tons. Among the negative factors, one can also note the Reuters report that Argentina does not exclude an increase in the limit of its corn exports in the 2021/2022 season to 35 million tons from 30 million tons. The corn crop in Argentina is estimated at 57 million tons. Russia increased the export of corn in April of this year to 325 thousand tons. This is 3 times more than in March.
Want to get more free analytics? Open Demo Account now to get daily news and analytical materials.
Want to get more free analytics? Open Demo Account now to get daily news and analytical materials.
Author

Dmitry Lukashov
IFC Markets
Dimtry Lukashov is the senior analyst of IFC Markets. He started his professional career in the financial market as a trader interested in stocks and obligations.


