Technical analysis: Will the copper quotes continue to rise?
Copper technical analysis summary
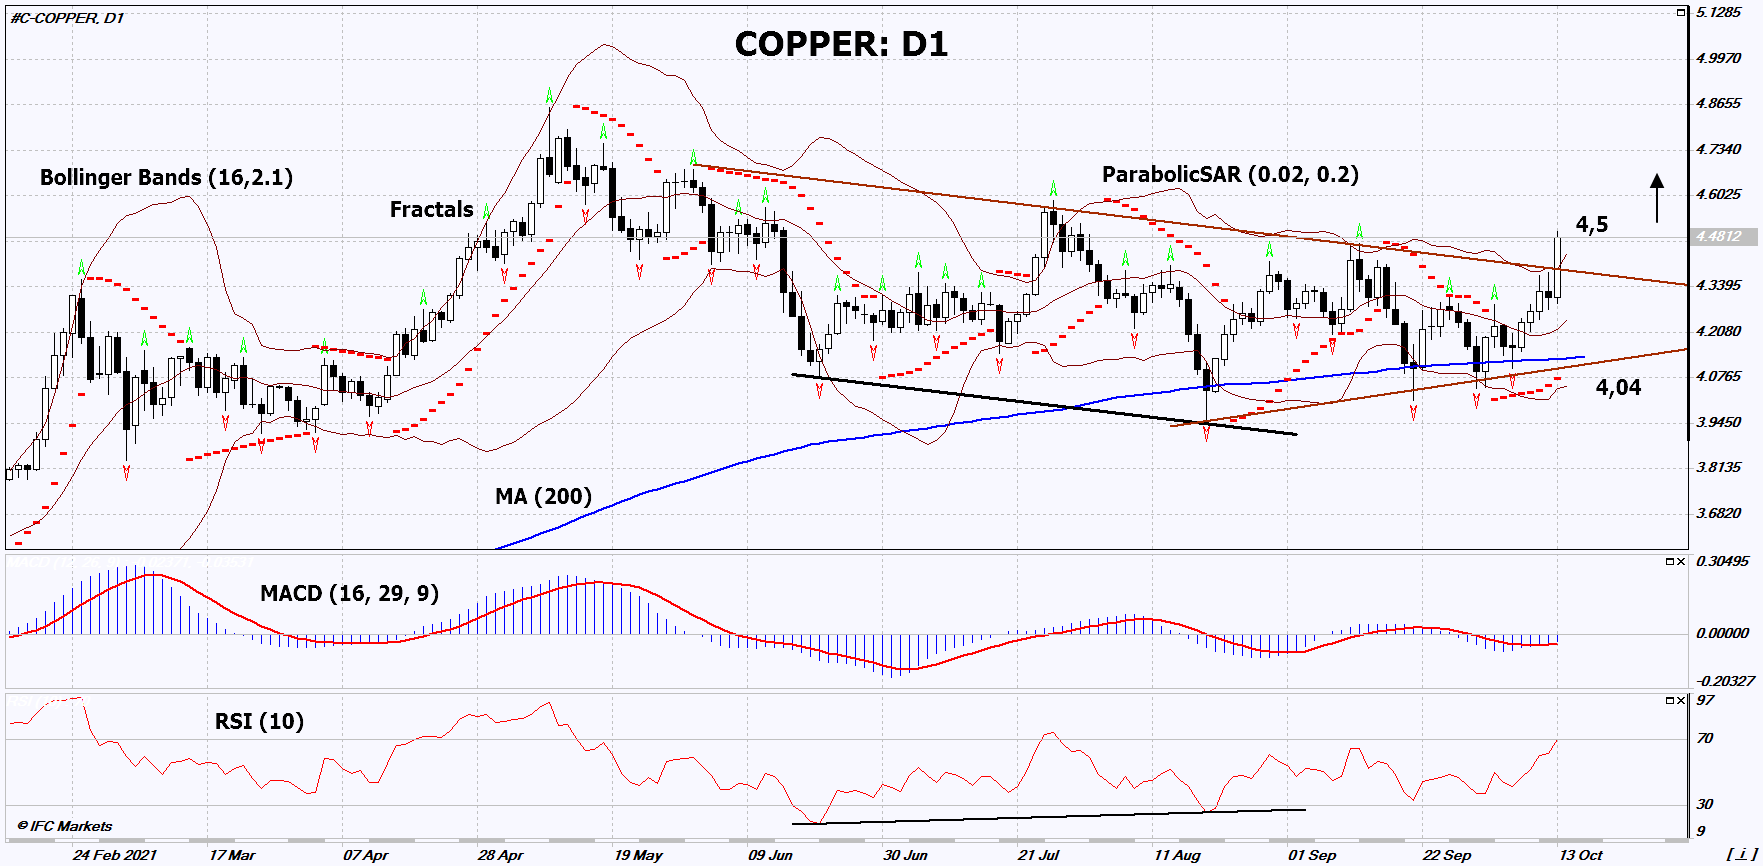
Buy Stop: Above 4.5
Stop Loss: Below 4.04
| Indicator | Signal |
| RSI | Neutral |
| MACD | Buy |
| MA(200) | Neutral |
| Fractals | Buy |
| Parabolic SAR | Buy |
| Bollinger Bands | Buy |
Copper chart analysis
Copper technical analysis
On the daily timeframe, COPPER: D1 came out of the triangle and downtrend. A number of technical analysis indicators have generated signals for further growth. We do not exclude a bullish movement if COPPER rises above the last upper fractal and upper Bollinger band: 4.5. This level can be used as an entry point. The initial risk limitation is possible below the 200-day moving average line, the Parabolic signal, the last 2 lower fractals and the lower Bollinger line: 4.04. After opening a pending order, move the stop to the next fractal low following the Bollinger and Parabolic signals. Thus, we change the potential profit / loss ratio in our favor. The most cautious traders, after making a deal, can go to the four-hour chart and set a stop-loss, moving it in the direction of movement. If the price overcomes the stop level (4.04) without activating the order (4.5), it is recommended to delete the order: there are internal changes in the market that were not taken into account.
Fundamental analysis of commodities - Copper
In September, imports of copper and copper concentrate to China increased. Will the COPPER quotes continue to rise?
According to the Chinese General Administration of Customs, copper imports to China in September 2021 amounted to 406 thousand tons, which is 3% more than in August. At the same time, for 9 months of this year, copper imports to China were 19.5% less than the same period last year. Investors do not exclude a further increase in imports, as stocks of refined copper in Shanghai in September fell by almost a third. This is the largest monthly decline since 2013. The General Administration of Customs also announced an increase in imports of copper concentrate to China in September to 2.1 million tonnes. This is almost 12% more compared to August and is very close to the all-time high of 2.14 million tonnes in September 2020.
Want to get more free analytics? Open Demo Account now to get daily news and analytical materials.
Want to get more free analytics? Open Demo Account now to get daily news and analytical materials.
Author

Dmitry Lukashov
IFC Markets
Dimtry Lukashov is the senior analyst of IFC Markets. He started his professional career in the financial market as a trader interested in stocks and obligations.


