Copper Elliott Wave technical analysis [Video]
![Copper Elliott Wave technical analysis [Video]](https://editorial.fxsstatic.com/images/i/copper-01_XtraLarge.jpg)
Copper Elliott Wave analysis
Market outlook
Copper and other precious metals remain in a corrective phase following the rally from May. This correction is part of the ongoing bullish cycle that started in April. The medium-term outlook still favors further upside once the current pullback completes.
Copper daily chart analysis
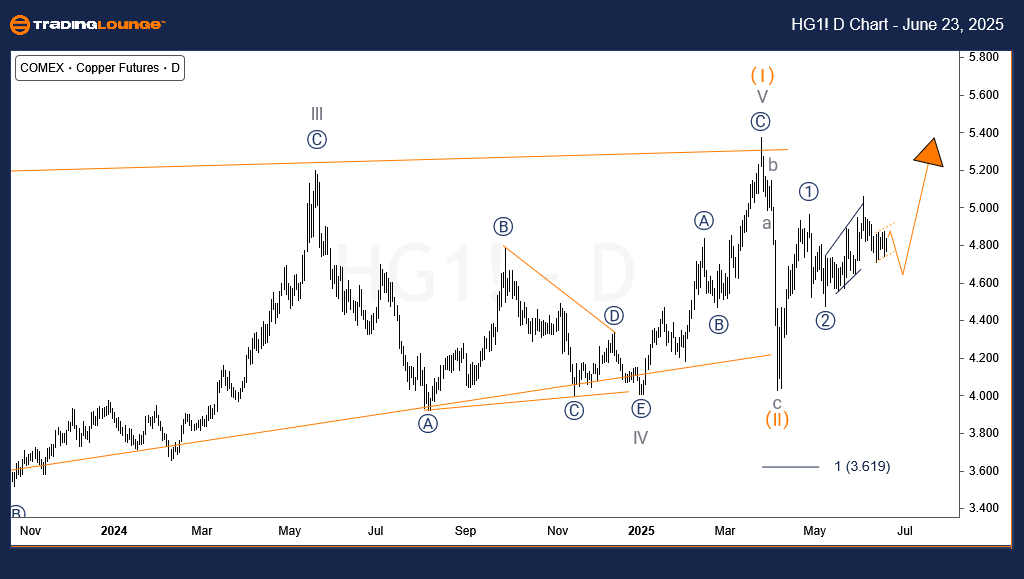
Copper began a major bullish phase in March 2020 with a 5-wave diagonal structure, which concluded in March 2025. This advance has been labeled as wave (I). As per Elliott Wave Theory, a 5-wave advance should be followed by a 3-wave correction. Copper followed this path precisely with a sharp decline after March 2025, forming wave (II), completed in April 2025.
Following wave (II), the market saw a strong recovery. However, due to the sharp nature of wave (II), some may interpret it as an impulse wave rather than a corrective one. This creates a scenario where, unless Copper breaks above its March 2025 high, a possible double correction for wave (II) could still develop below the April 2025 low.
From the April low, Copper completed a 5-wave rally as wave ((1)) of I of (III), followed by a pullback identified as wave ((2)), completed on May 8th. The subsequent move upward may represent waves (1) and (2) of ((3)).
Copper four-hour chart analysis
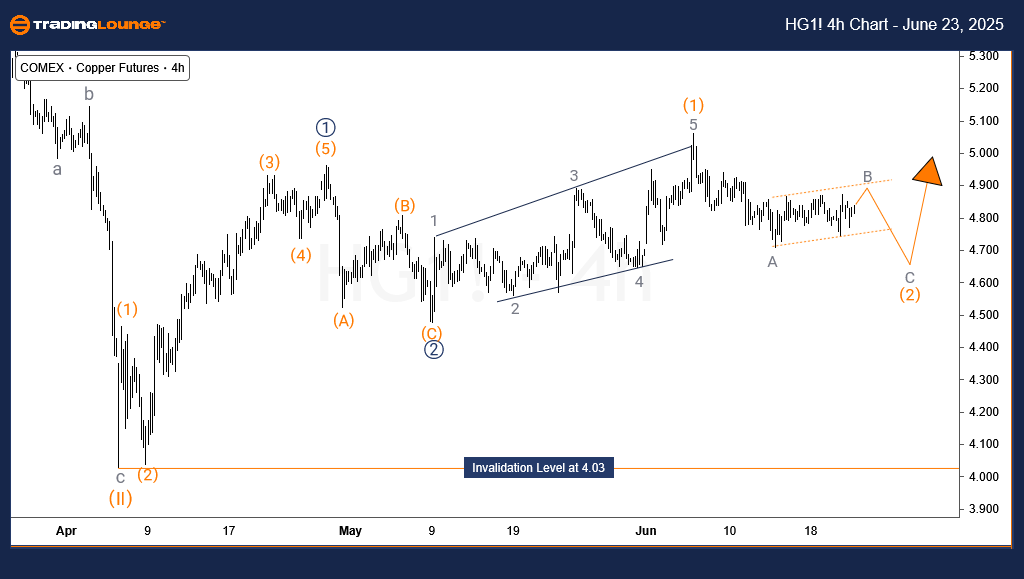
The H4 chart shows that price is likely in wave B of (2), following the completion of wave A on June 13th. A further move lower remains possible to complete wave (2) before a continuation to the upside.
As long as the 09-May low and especially the 06-April low remain intact, the bullish trend should stay supported. These levels serve as key support areas for the current wave structure.
Copper Elliott Wave technical analysis [Video]
Author

Peter Mathers
TradingLounge
Peter Mathers started actively trading in 1982. He began his career at Hoei and Shoin, a Japanese futures trading company.


