|

Copper Elliott Wave technical analysis [Video]

Copper Elliott Wave analysis

The sell-off on Copper from the late September high is set to continue lower toward the September lows. However, the phase is corrective. Thus, the larger bullish cycle from August 2024 and October 2023 should continue afterward toward the highs of the year 2024.

From the long-term perspective, the commodity is clearly within the bullish cycle that started in March 2020. In addition, Copper's long term from the March 2020 low is structurally evolving in a diagonal structure. Meanwhile, this diagonal structure is expected to complete the much larger bullish cycle that started pre-2000.

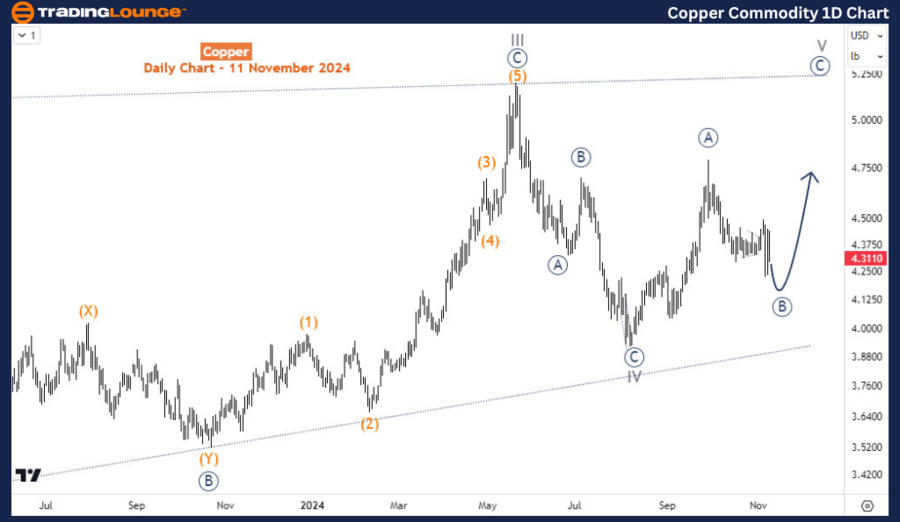
The daily chart analysis

On the daily chart, the evolving diagonal from March 2020 has probably completed wave IV and is now correcting the wave ((A)) of V. This means, the price is down in wave ((B)) of V. Provided the August 2024 low of wave IV is unbreached and wave ((B)) completes a corrective structure, the idea in the long-term still supports the upside.

Copper

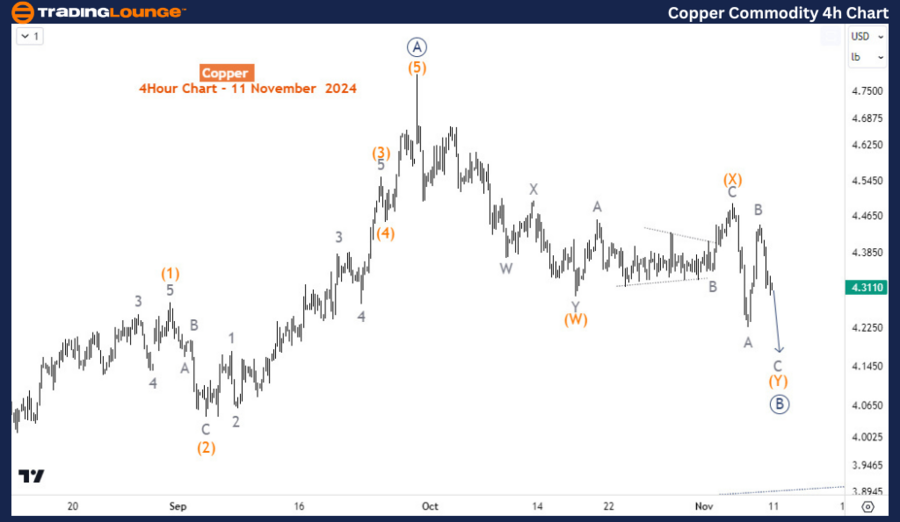
The four-hour chart analysis

The H4 chart focuses on the sub-wave development of wave ((B)) which is emerging into a double zigzag wave pattern. Wave (X) of ((B)) has already finished and the price is in wave (Y) - precisely in wave C of (Y) of ((B)). Thus, the corrective phase from September 2024 could extend lower toward 4.15-4.00 to complete wave ((B)) before the next bullish phase begins for wave ((C)).

Copper

Copper Elliott Wave technical analysis [Video]

Author

Peter Mathers

Peter Mathers

TradingLounge

Peter Mathers started actively trading in 1982. He began his career at Hoei and Shoin, a Japanese futures trading company.

More from Peter Mathers
Share:

Markets move fast. We move first.

Orange Juice Newsletter brings you expert driven insights - not headlines. Every day on your inbox.

By subscribing you agree to our Terms and conditions.

Editor's Picks

EUR/USD drops to daily lows near 1.1630

EUR/USD now loses some traction and slips back to the area of daily lows around 1.1630 on the back of a mild bounce in the US Dollar. Fresh US data, including the September PCE inflation numbers and the latest read on December consumer sentiment, didn’t really move the needle, so the pair is still on course to finish the week with a respectable gain.

GBP/USD trims gains, recedes toward 1.3320

GBP/USD is struggling to keep its daily advance, coming under fresh pressure and retreating to the 1.3320 zone following a mild bullish attempt in the Greenback. Even though US consumer sentiment surprised to the upside, the US Dollar isn’t getting much love, as traders are far more interested in what the Fed will say next week.

Gold makes a U-turn, back to $4,200

Gold is now losing the grip and receding to the key $4,200 region per troy ounce following some signs of life in the Greenback and a marked bounce in US Treasury yields across the board. The positive outlook for the precious metal, however, remains underpinned by steady bets for extra easing by the Fed.

Crypto Today: Bitcoin, Ethereum, XRP pare gains despite increasing hopes of upcoming Fed rate cut

Bitcoin is steadying above $91,000 at the time of writing on Friday. Ethereum remains above $3,100, reflecting positive sentiment ahead of the Federal Reserve's (Fed) monetary policy meeting on December 10.

Week ahead – Rate cut or market shock? The Fed decides

Fed rate cut widely expected; dot plot and overall meeting rhetoric also matter. Risk appetite is supported by Fed rate cut expectations; cryptos show signs of life. RBA, BoC and SNB also meet; chances of surprises are relatively low.

Ripple faces persistent bear risks, shrugging off ETF inflows

Ripple is extending its decline for the second consecutive day, trading at $2.06 at the time of writing on Friday. Sentiment surrounding the cross-border remittance token continues to lag despite steady inflows into XRP spot ETFs.