Copper Elliott Wave technical analysis [Video]
![Copper Elliott Wave technical analysis [Video]](https://editorial.fxstreet.com/images/Markets/Commodities/Metals/Copper/copper-wire-530233_XtraLarge.jpg)
Copper Elliott Wave analysis
Function - Counter-Trend.
Mode - Impulse wave a of (IV).
Structure - IMpulse wave.
Position -Wave (3) of 5 (circled).
Direction - Wave (4).
Details - The decline from 20th May is better suited for an impulse structure. Thus, the price is expected to drop lower to complete the cycle degree wave a. It’s currently in wave 5 (circled) of the cycle degree, close to completing an ending diagonal structure.
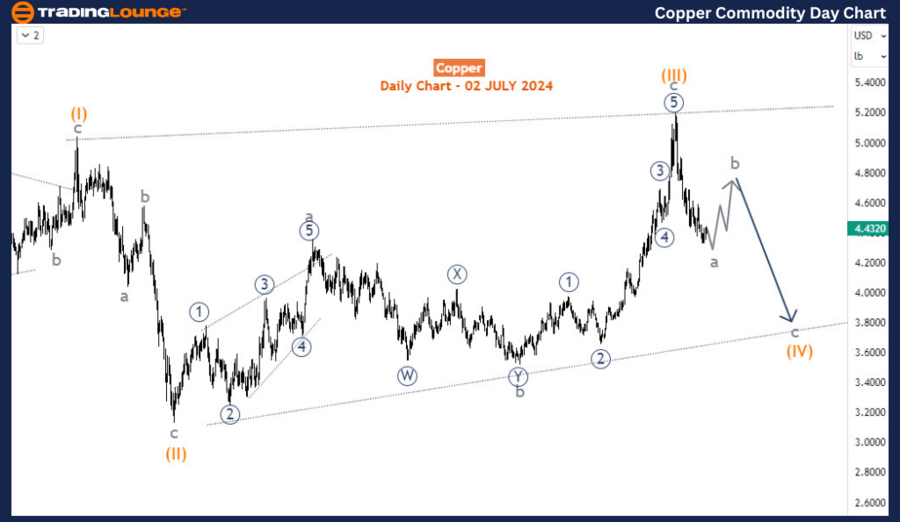
Since 17th May 2024, Copper has shed nearly 15% as it corrects the strong rally from October 2023. The correction from May 2024 appears to go much deeper to complete at least a 3-swing chart structure. However, the long-term trend still supports the upside but buyers should not be in a hurry. Meanwhile, before the decline continues, the commodity could make a minor bounce, correcting the current sell-off from 17th May 2024.
In the long term, it appears that the price is in a bullish corrective cycle - wave A-B-C of the grand supercycle degree. Wave B completed a triangle structure that lasted 17 months when it ended in April 2022. Since then, a bullish diagonal structure has emerged for wave C of the supercycle degree. Thus, the long-term trend still supports buyers. However, there will be some sharp pullbacks in between.
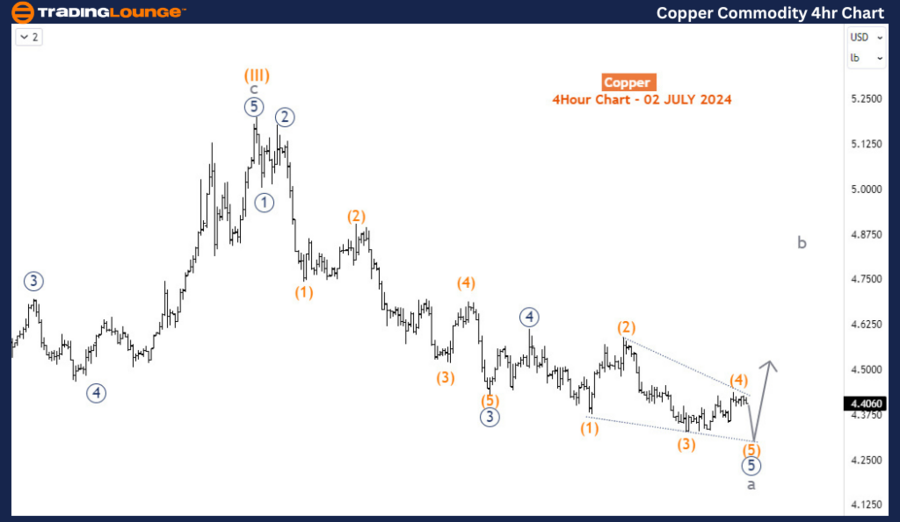
On the daily chart, the diagonal completed its 3rd sub-wave, wave (III) of the supercycle degree in May 2024. A decline for wave (IV) ensued and is currently ongoing. Wave (IV) is expected to complete a corrective structure - ABC or WXY. Wave a of (IV) is close to completion and thus a resurgence for wave b of (IV) could follow. The H4 chart shows how far wave a of (IV) has gone and how further it could go before it’s concluded and b begins upwards.
On the H4 chart, the sell-off from May 2024 is emerging into an impulse wave for wave 5 (circled) of a. Currently at the sub-waves (4) of a diagonal wave 5 (circled) which is expected to be the last leg. If the diagonal concludes as expected, then sellers should be wary of a corrective surge. However, buyers shouldn’t get over-ambitious as the rally will most likely be corrective, leading to another round of sell-offs before wave (IV) ends and the price starts pushing upside for wave (V) in the long term.
Copper Elliott Wave technical analysis [Video]
Author

Peter Mathers
TradingLounge
Peter Mathers started actively trading in 1982. He began his career at Hoei and Shoin, a Japanese futures trading company.


