Copper Elliott Wave technical analysis [Video]
![Copper Elliott Wave technical analysis [Video]](https://editorial.fxstreet.com/images/Markets/Commodities/Metals/Copper/copper-bars-background-15986425_XtraLarge.jpg)
Copper Elliott Wave analysis
Function - Trend.
Mode - Impulse.
Structure - Impulse wave.
Position -Wave 4.
Direction - Wave 4 is in progress.
Details - Blue wave ‘b’ should be about to start but we need price commitment to the upside first.
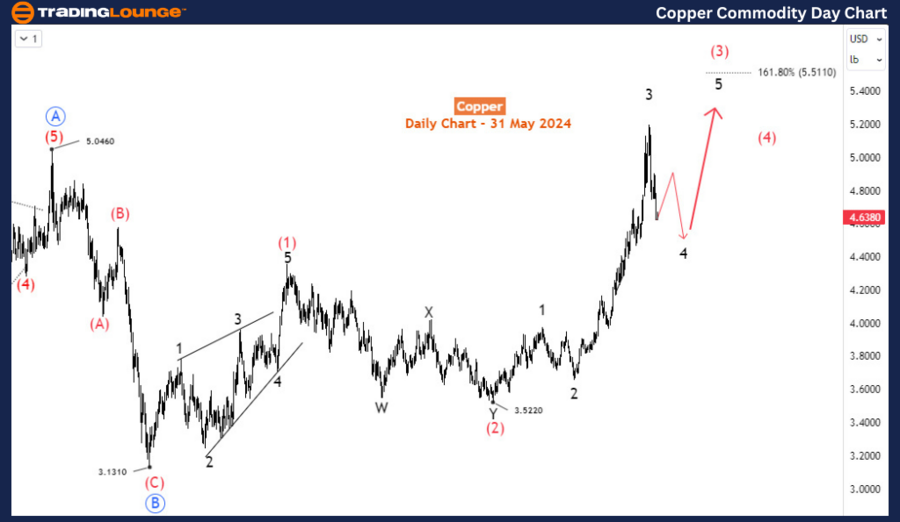
Copper is currently experiencing a pullback from a year-long impulse wave structure. This presents an opportunity for buyers to wait for the next low before entering the market, as the larger bullish structure that began in July 2022 remains intact. However, the ongoing pullback from May 17th is not yet complete, so buyers will likely need to wait a few more weeks before the next rally.
The daily chart indicates that a corrective structure concluded at 3.131 in July 2022. This correction followed an impulse wave that began in March 2020 and ended in July 2022 at 5.046. The high at 5.046 and the low at 3.131 are labeled as primary degree waves A and B (circled in blue), respectively. The corresponding wave C (circled in blue) started at the 3.131 low in July 2022 and has developed into a bullish impulse wave sequence. Currently, the price is in intermediate wave (3) of blue wave C, which is expected to extend to at least 5.511, suggesting further upside potential. The ongoing pullback is identified as wave 4 of (3). Once wave 4 concludes, wave 5 should advance towards 5.511. To gauge the completion of wave 4, it is essential to analyze its sub-waves and emerging structure.
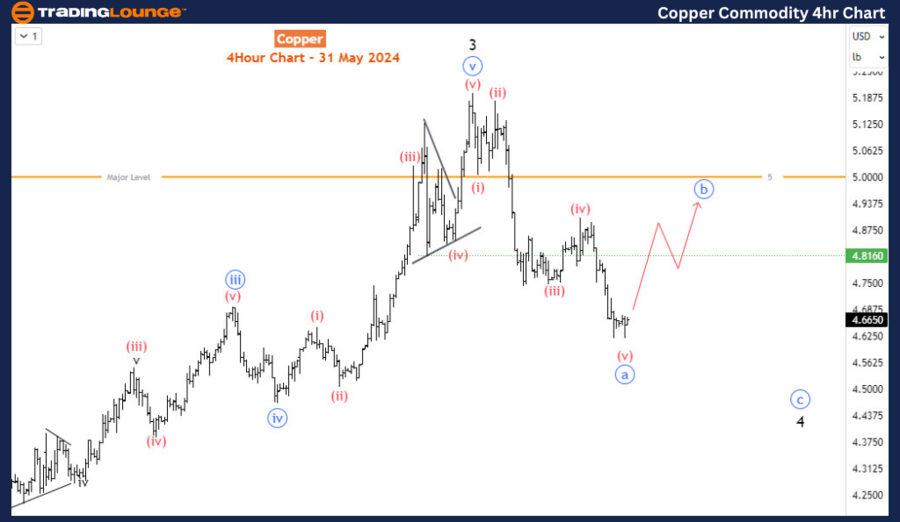
The H4 chart shows that the decline from the top of wave 3 (May 2024 high) is forming an impulse wave. This suggests that wave 4 is likely forming a zigzag pattern, subdividing into waves a-b-c (circled in blue). The current bearish impulse is nearing the completion of blue wave ‘a’, after which wave ‘b’ is expected to move upwards, followed by a final leg down for wave ‘c’. This is the ideal scenario for the current market structure.
In summary, copper prices are in a pullback phase from a significant impulse wave, and buyers should wait for this correction to conclude before entering the market. The larger bullish structure that started in July 2022 is still intact, with intermediate wave (3) of blue wave C potentially extending to 5.511. The current pullback, identified as wave 4 of (3), is forming a zigzag pattern, with the H4 chart showing the development of waves a-b-c. Monitoring the completion of wave 4 will be crucial for timing the next entry point, as wave 5 is expected to push prices higher towards the target of 5.511.
Technical analyst: Sanmi Adeagbo.
Copper Elliott Wave analysis [Video]
Author

Peter Mathers
TradingLounge
Peter Mathers started actively trading in 1982. He began his career at Hoei and Shoin, a Japanese futures trading company.


