Conventional wisdom isn't wisdom in 2022
There is a liquidity and civility drought in the commodity and financial markets.
Starting in late December 2021 we started to see liquidity drain from the bond market, but as volatility has infiltrated other markets in recent months we are seeing a liquidity drought everywhere we look. In some cases, this means the daily trading volume and open interest have declined sharply but in other cases, volume has remained relatively stable yet market makers have become more risk-averse (wider bid/ask spreads). In either case, the result is price slippage when entering and exiting positions and, more importantly, enhanced volatility. When prices aren't moving smoothly through the price discovery process, market participants experience anxiety and are more prone to panic trading. In our view, this is what we are seeing in most asset classes...and it is far from desirable.
The lack of liquidity works against the emotions of traders in multiple ways; it increases the odds of futures traders being stopped out and often exaggerates the price impact of stop-loss running. For option sellers, low levels of liquidity translate into larger drawdowns during volatility spikes and increased propensity for margin calls or price squeezes (often Gamma squeezes, where traders are forced to buy or sell futures to hedge short option exposure). As traders cope with the consequences of lower liquidity, emotions run hot and price volatility tends to increase. Welcome to 2022.
We've been hearing from bond managers how ETFs are ruining the markets for years but the warning didn't truly sink in until we saw what happens when millions of "mom and pop" investors all hit the sell button on their diversified ETFs and/or mutual funds at the same time. I can't say I blame them, even the most conservative of diversified portfolios looked horrendous in the first quarter of the year. I ran some sample allocations in software that produces stats on the historical performance of the holdings throughout history and it was shocking. A well-balanced mix of ETFs with a 50/50 blend of stocks, high-quality bonds (both domestic and international), along with Treasuries and other government fixed-income securities was down 16% to 19% year to date, with the previous record annual drawdown of about 6% occurring in 1930. This sample portfolio had only posted losses in 8 of the previous 50 years...yet, in 2022 it was getting crushed (at least relative to the assumed risk of the portfolio) despite historically being a robust mix.
I suspect liquidity and mass liquidation of ETFs were the culprits. For what it is worth, this was the portfolio allocation I came into the year with suspecting it would hold up to market turmoil. I was right about the market turmoil but wrong about asset prices. I'm sure I am not alone in this...thus, widespread liquidation.
Now, more than ever, stay safe. Conventional wisdom might not be wisdom at all in this environment.
Treasury futures markets
30-year Treasury Bond Futures
Treasuries bounce but are still deep in the hole
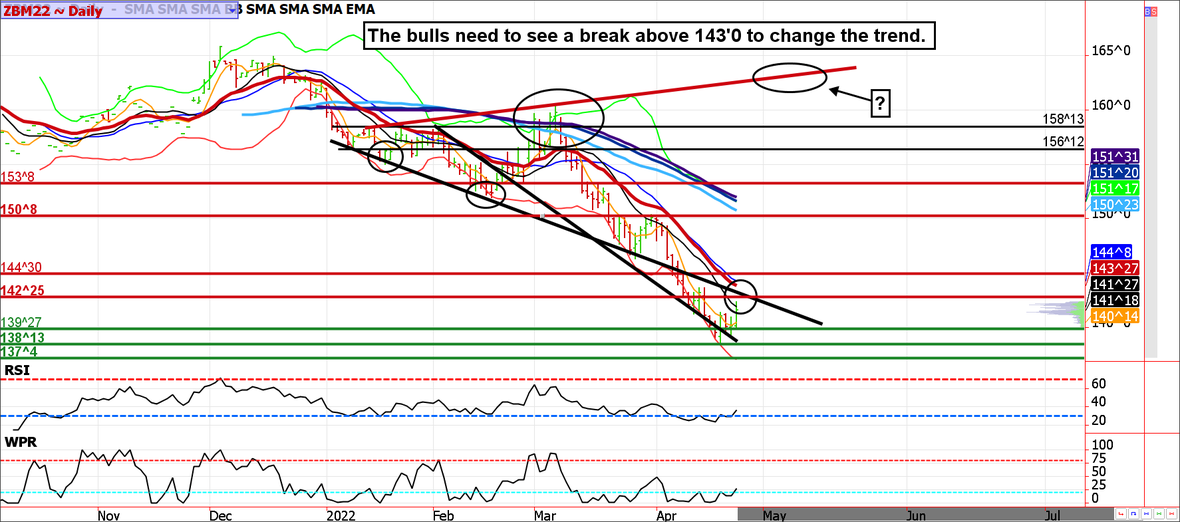
After weeks of pummeling, we are starting to see signs of life in Treasuries. That said, even if this is some sort of bottom, it will be a process. Don't be shocked if we see some sellers come in tomorrow. After all, selling rallies has worked well in this environment, and until it stops working traders will be tempted to continue the behavior. That said, speculators are holding unhealthy and aggressive short positions in the 10-year note. This leaves the door open for a massive short squeeze, which we believe will eventually materialize.
Treasury futures market consensus
Being a bond bull has been a relentless pain trade...but believe it or not, Treasuries usually rally after QE ends and rate tightening beings (sell the rumor buy the fact).
Technical Support: 139'27, 138'13, and 137'04 ZN: 118'05 and 117'20
Technical Resistance: ZB: 142'25, 144'30, 146'14, 150'08, 153'08, 156'01, 158'09, and 160'12 ZN: 120'20, 122'10, 123'10, 125'15, 127'10 and 128;21.
Stock Index Futures
A Key Reversal in the ES and positive earnings reports could lure buyers
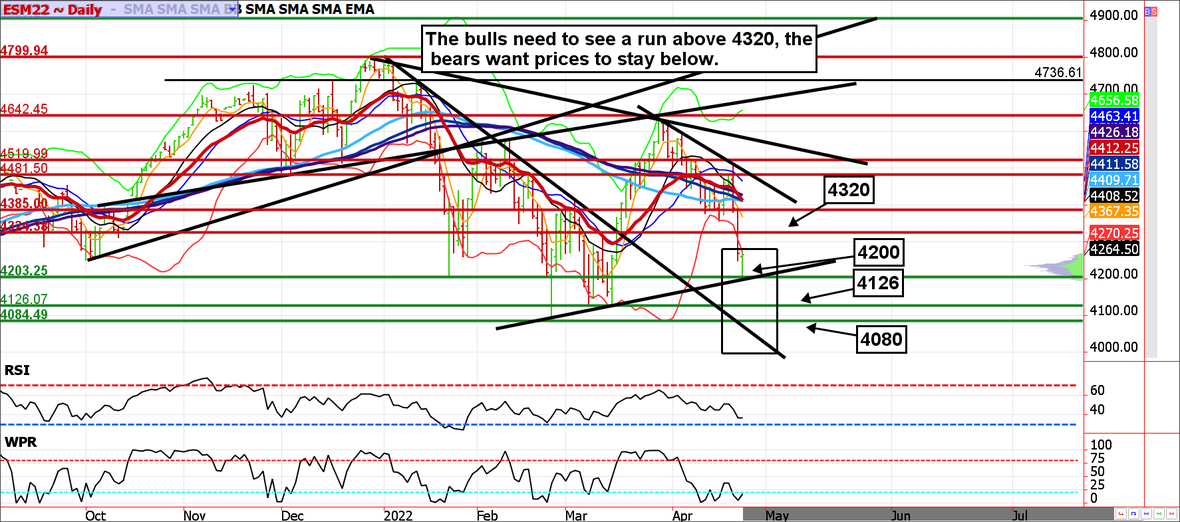
Volatility is intense and the bulls aren't out of the woods but weak Sunday night/Monday morning trade is a common turning point. The daily price bar has put in a key reversal and a mini trendline drawn from the February low to the mid-March lows looks to have attracted buyers near 4200. If the momentum carries the ES above 4320, the bulls will have something. If they can't, we would likely see a slide toward 4080/4000. Based on today's sweeping reversal pattern, we are leaning toward the former.
Stock index futures market consensus
Support near 4200 held, a close above 4320 would likely trigger a massive short squeeze.
Technical Support: 4200, 4125, 4080, and 4000
Technical Resistance: 4320, 4385, 4480, 4520, 4640, 4740, 4808, 4875 and 4905
E-mini S&P futures swing/day trading levels
These are counter-trend entry ideas, the more distant the level the more reliable but the less likely it is to get filled
ES Day Trade Sell Levels: 4320, 4380, 4510, 4589, 4650, 4720, and 4810
ES Day Trade Buy Levels: 4170, 4120, 4080, and 4000
In other commodity futures and options markets
October 20 - Buy December 2022 (not 21) $7.00 corn calls near 12 cents.
March 28 - Bull call spread with a naked leg in July wheat (buy the July $10.50, sell the $12.00, and then sell the $9.50 put for a net credit of about 5 cents).
March 30 - Bull call spread with a naked leg in July coffee (buy the July 225 call, sell the July 240 call and sell the 200 put).
April 4 - Bull call spread with a naked leg in July soybeans (buy July $16 call, sell the $17.20 call and sell the $14.50 put). Total cost is about 18 cents, risk is unlimited below $14.50.
April 7 - Buy June hog 127 calls.
April 11 - Bull call spreads with naked puts in September oil (buy the September $95 call, sell the $105 call and the $75 put).
April 12 - Buy August cattle 142.00 call.
April 12 - Buy June Yen 0.82 call.
April 13 - Buy July sugar 20.00 put.
April 14 - Bull call spread with a naked leg in the euro (buy July $1.10 call, sell the $1.12 call and sell the $1.05 put)
April 20 - Bear put spread with naked call in November soybeans (Buy November $15 put, sell November $14 put, and sell the $18 call).
April 21 - Buy March 2023 eurodollar 98 calls near 12 points ($300).
April 21 - Bull call spread with a naked leg in August gold (buy the $1975 call, sell the $2075 call and sell the $1850 put).
April 22 - Bull call spread with a naked leg in July Silver (Buy the $25 call, sell the $26.50 call, and sell the $22 put).
Author

Carley Garner
DeCarley Trading
Carley Garner is an experienced commodity broker with DeCarley Trading, a division of Zaner, in Las Vegas, Nevada. She is also the author of multiple books including, “Higher Probability Commodity Trading” and “A Trader's First Book on Commodities”.


