Consolidation on forex with Brexit and inflation focus for sterling

Market Overview
The US dollar has been supported by higher Treasury yields again as the US 10 year Treasury yield has move back above2.40% again. However, there seems to be something of a hiatus in currency markets with a lack of direction in recent sessions. Major markets such as EUR/USD, USD/JPY and gold have moved into consolidation phases. The only real mover has been sterling where traders have been fretting over the stability of UK Prime Minister May’s Government. Brexit negotiations have not been progressing as well as some might have expected and the pressure will be ramped up further in the UK Parliament today with scrutiny for the current plan today. To add to the Brexit impact, the latest readings of UK inflation are announced this morning and once more it could be in sterling crosses where we see the most action. Equity markets have been hit by a risk off sentiment in recent sessions as the markets have taken a dim view of the prospects for US tax reform. The overnight disappointing Chinese economic data will do little to help. China Industrial Production fell to 6.2% (+6.3% exp, +6.6% last), with China Retail Sales dropping to 10.0% (+10.4%exp, +10.3% last). This hit sentiment in the Asian session.

Wall Street rebounded into the close to finish the day mildly higher (S&P 500 +0.1% at 2585), with the Nikkei almost dead flat, just 1 tick lower. European markets are also subdued cautiously higher in early moves. In forex there is a mixed bag again with slight gains on the euro on positive German GDP and underperformance on sterling. The Kiwi is the big faller on the day, down -0.7%. In commodities, the consolidation range on gold continues whilst oil is beginning to just drift a touch lower.
European data will come thick and fast today with the UK CPI inflation being first on the agenda at 0930GMT. Inflation is expected to tick higher on both headline and core, with the headline CPI expected to be up to +3.1% (from +3.0%) and core CPI up to +2.8% (from +2.7% last month). Also watch the UK PPI input prices (which help to paint a picture of imported inflation due to sterling weakness) which are expected to drop back to +4.8% (from +8.4% last month). The prelim reading of Eurozone Q3 GDP is at 1000GMT and is expected to be +0.6%, whilst the German ZEW Economic Sentiment is also at 1000GMT and is expected to improve to +20.0 (from +17.6 last month). Central Bankers due to speak as part of a panel discussion on central bank communication at the ECB in Frankfurt at 1000GMT include Mark Carney of the BoE, Governor Kuroda of the BoJ and Janet Yellen of the Federal Reserve. US PPI is at 1330GMT and is expected to drop to +2.4% on the headline and increaser to +2.3% on core PPI.
Chart of the Day – USD/CAD
The medium term outlook for an improving dollar took a bit of a hit last week but has this now produced another chance to buy? Yesterday’s positive candle in the wake of Friday’s doji (denoting uncertainty with the prevailing trend) was a second consecutive candle that posted another higher low above last week’s 1.2663 low. In addition to this, the support has come in bang on the trend support of a two month uptrend and the top of the old breakout range support 1.2585/1.2660. The RSI has unwound to turn up again once more around 50 too. Another positive candle today would break a 10 day downtrend and suggest the bulls are gathering momentum once more for the next push higher. Initial resistance is at last week’s high of 1.2820 and a retest of the 1.2915 October/early November resistance would be back in play again. The outlook of a near term correction within a medium term bull trend recovery would be breached below 1.2585.

EUR/USD
The market is consolidating around the neckline of the large top still. Yesterday’s doji candle reflects an uncertain position that the market faces, a position which has continued into today’s session. On a medium term basis, with the two month downtrend now falling at $1.1740, the 38.2% Fibonacci retracement at $1.1735 and the resistance of the old lows around $1.1730, this gives a sell zone between $1.1660/$1.1730 within which I expect to see the next lower high. Momentum is picking up near term to reflect the rebound off $1.1550 however the RSI has struggled around 50 and the MACD lines are just unwinding back to neutral. This suggests that the next sell signal is not far off. The hourly chart shows limited upside momentum in this move higher and that it is likely to peter out soon. Initial support at $1.1635 and $1.1620.

GBP/USD
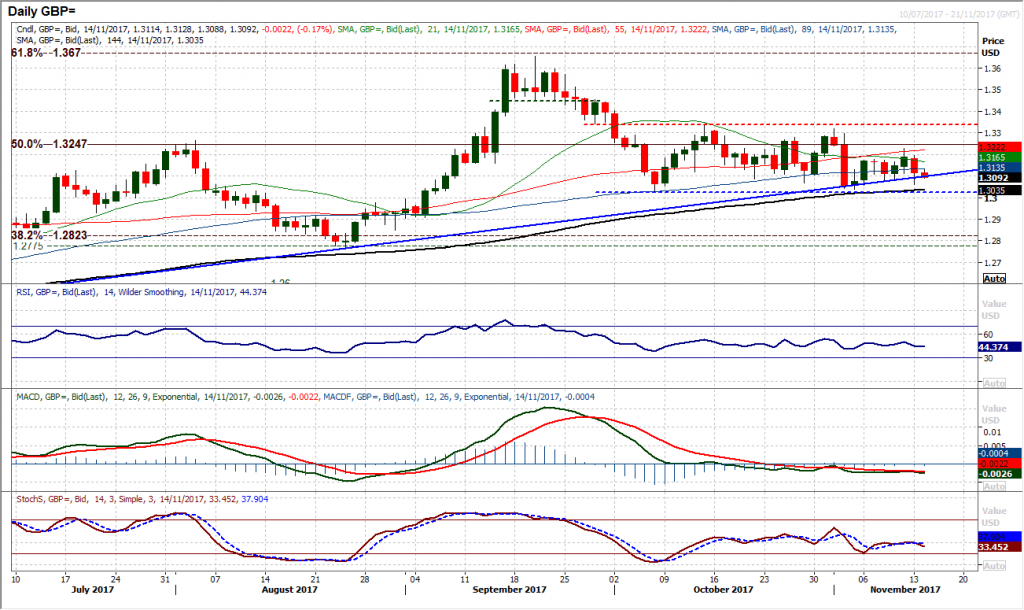
The threat to the 12 month uptrend continues. Yesterday’s bearish candle may have closed well above the day low of $1.3060 however the negative bias within the five week trading range is still present. Another bear candle today would really add to the pressure that is building now. Momentum indicators show limited direction but are just tailing off again and suggest that support could now be tested. A close below $1.3100 would begin to confirm the uptrend being broken whilst $1.3060 is certainly not a solid support. The key range low remains at $1.3025 and will be a big concern for the bulls if this is breached. The hourly chart shows momentum indicators rolling over this morning with the intraday rebound failing at $1.3135 yesterday. This shows that intraday rallies are now a chance to sell.
USD/JPY
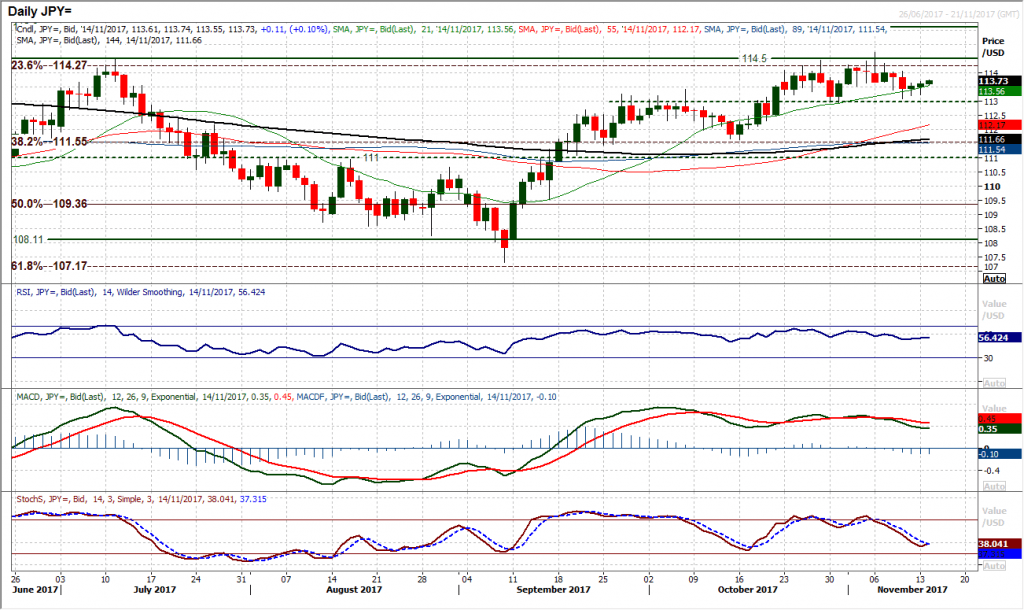
The market is increasingly building a range between 1112.95/114.72. The bulls seem to be repelling the corrective forces that threatened the key near term support at 112.95 and are looking to build once more. After a phase of largely negative candles, the market has formed a positive candle that has included a second successive higher low and a second successive positive close. The move is helping to calm the corrective momentum, with the decline on the MACD lines just tailing off and the Stochastics also settling down whilst the RSI remains above 50. The hourly chart shows benign moving averages and momentum indicators forming a trading range outlook. A decisive move above initial resistance at 113.70 would improve the complexion of the chart further, with the lower high at 114.05 then a test. The higher low at 113.10 supports above the key 112.95 low.
Gold
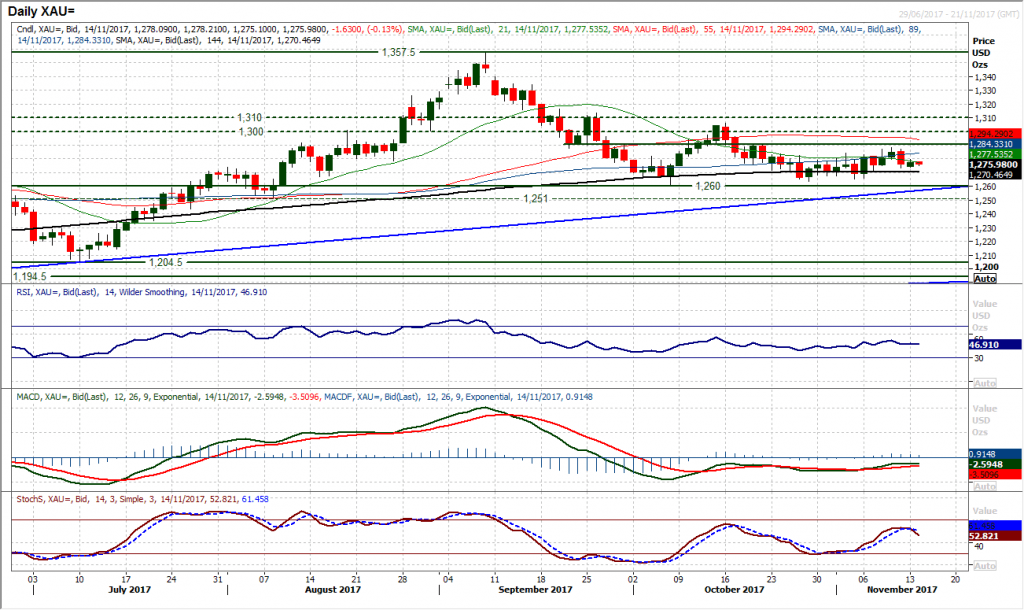
The mixed signals from gold continue to be thrown about, leaving the chart with an uncertain outlook. Looking past the noise of the daily candles there is a feeling that this is a rangebound chart above the key medium term support band $1251/$1260 but below the $1290 resistance. Friday’s strong bear candle is still hanging over the outlook as yesterday’s minor rebound has made little real impact, only to steady the ship slightly. This remains a chart waiting for a catalyst and the benign configuration of the momentum indicators reflects this. Recent price resistance at $1288, as the gains whilst the market is underpinned by the recent low at $1263, making a $25 range with the market broadly stuck in the middle. The hourly chart shows almost no direction to speak of either. Below $1273 would increase the negative near term momentum whilst above $1280 increases the positive momentum.
WTI Oil
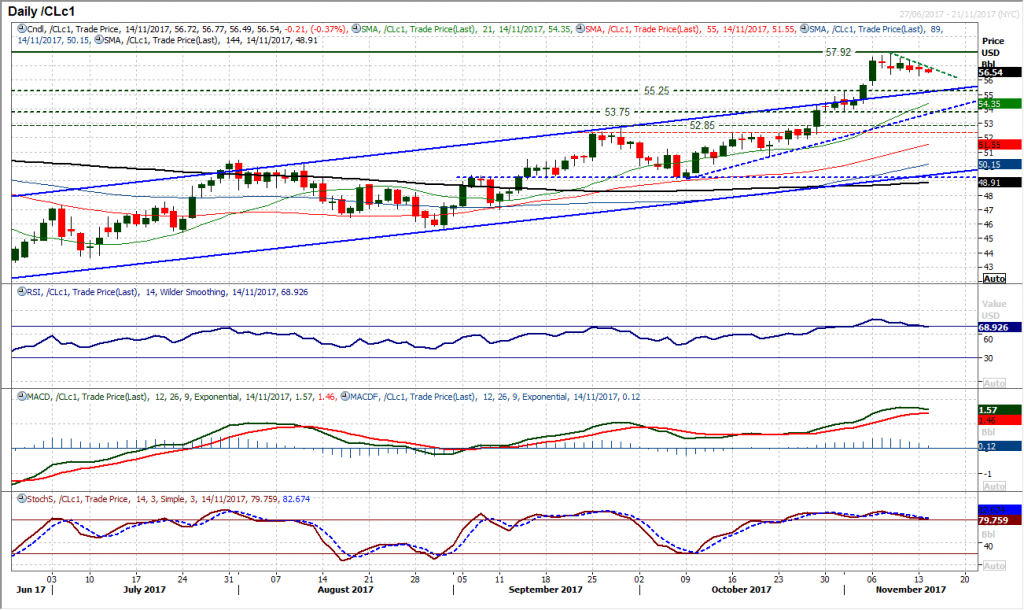
The consolidation continues on WTI as another sideways move was seen yesterday. However, there is a slight negative bias that is now forming as the market briefly saw an intraday breach of the initial support at $56.40. A negative close and a mild drop back again today that is again eying the recent lows means that the prospect of a drift back towards the breakout support at $55.25 is increasing. The momentum indicators are beginning to drift lower too with the RSI pulling back below 70, however, for now this is a fairly orderly slip back. A close below $56.40 would add to the corrective momentum. The small bodies of the negative candles suggests that this looks to be a consolidation that is helping to unwind momentum rather than the pre-cursor to a strong technical correction. The hourly chart continues to suggest that this is a consolidation and there is a degree of control to this decline.
Dow Jones Industrial Average
The broken 8 week uptrend and corrective configuration of the momentum indicators suggests that the selling pressure is growing, however this does not mean that there will be a straight line correction and there are likely to be some bumps along the way. Yesterday’s session was just that, however with corrective momentum indicators the market looks set to still put added pressure on the support band now in place between 23,250/23,310. There is a near term pivot around 23,485 which is now a basis of resistance near term and a gauge for control now. A close back above 23,485 would begin to improve the outlook once more. The hourly chart shows a more negative configuration on hourly momentum indicators now with the RSI failing under 60.

Author

Richard Perry
Independent Analyst


