Comey Speaks

Good Morning Traders,
As of this writing 3:45 AM EST, here's what we see:
US Dollar: Jun. USD is Down at 96.660.
Energies: Jul Crude is Up at 46.01.
Financials: The Sept 30 year bond is Down 4 ticks and trading at 154.12.
Indices: The June S&P 500 emini ES contract is 8 ticks Higher and trading at 2434.00.
Gold: The Aug gold contract is trading Down at 1289.30. Gold is 39 ticks Lower than its close.
Initial Conclusion
This is not a correlated market. The dollar is Down- and crude is Up+ which is normal and the 30 year bond is trading Lower. The Financials should always correlate with the US dollar such that if the dollar is lower then bonds should follow and vice-versa. The indices are Up and Crude is trading Up which is not correlated. Gold is trading Down- which is not correlated with the US dollar trading Down-. I tend to believe that Gold has an inverse relationship with the US Dollar as when the US Dollar is down, Gold tends to rise in value and vice-versa. Think of it as a seesaw, when one is up the other should be down. I point this out to you to make you aware that when we don't have a correlated market, it means something is wrong. As traders you need to be aware of this and proceed with your eyes wide open.
At this hour all of Asia is trading mixed with half the exchanges higher and the other half lower. Europe is mainly higher with the exception of the London and Milan exchanges which are trading down at this hour.
Possible Challenges To Traders Today
– Unemployment Claims are out at 8:30 AM EST. This is major.
– Natural Gas Storage is out at 10:30 AM EST. This is major.
Treasuries
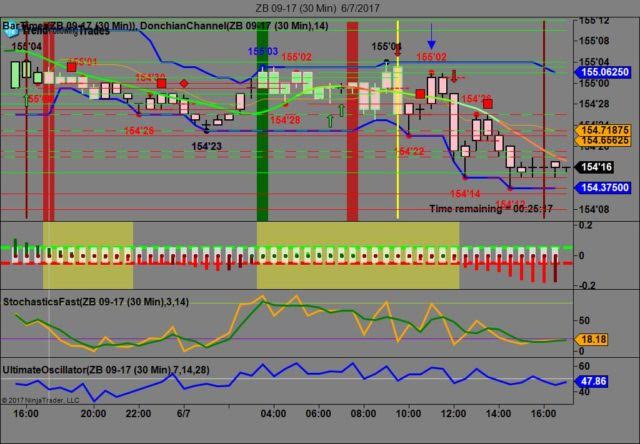
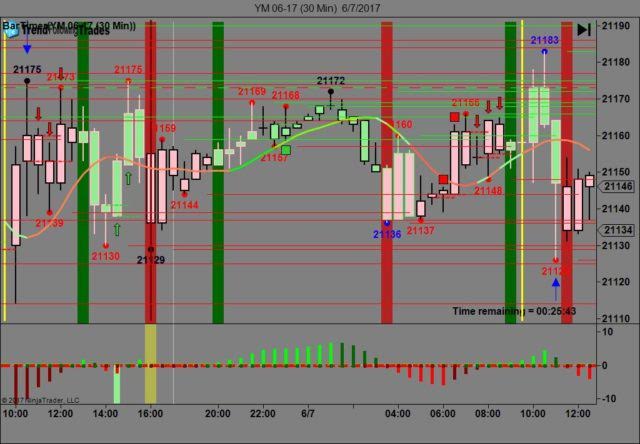
We've elected to switch gears a bit and show correlation between the 30 year bond (ZB) and The YM futures contract. The YM contract is the DJIA and the purpose is to show reverse correlation between the two instruments. Remember it's liken to a seesaw, when up goes up the other should go down and vice versa.
Yesterday the ZB made it's move at around 11 AM EST after the crude oil inventories were released. The ZB hit a high at around that time and the YM hit a low. If you look at the charts below ZB gave a signal at around 11 AM and the YM was moving higher at the same time. Look at the charts below and you'll see a pattern for both assets. ZB hit a high at around 11 AM and the YM hit a low. These charts represent the newest version of Trend Following Trades and I've changed the timeframe to a 30 minute chart to display better. This represented a shorting opportunity on the 30 year bond, as a trader you could have netted about 20 ticks per contract on this trade. Each tick is worth $31.25. We added a Donchian Channel to the charts to show the signals more clearly. Please note that the front month for the ZB contract is now September, 2017.
Charts Courtesy of Trend Following Trades built on a NinjaTrader platform
Bias
Yesterday we gave the markets a neutral bias as the futures didn't show any sense of direction yesterday morning. The Dow closed up 37 points and the other indices gained ground as well. Today we aren't dealing with a correlated market however our bias is to the upside.
Could this change? Of Course. Remember anything can happen in a volatile market.
Commentary
Yesterday morning we gave the markets a neutral bias as the indices showed no sense of direction or commitment, hence the neutral bias. Today we have the long awaited testimony of former FBI Director James Comey and just to put this into its proper context; Comey won't provide judgement but will state the facts as they are and allow others to decide. This no doubt will annoy the politicians who would gladly take the easy way out and let another condemn Trump. Politicians always want easy. As a case in point last year I asked a famous Senator to help me with issues I was having with healthcare, all to no avail. And the folks in DC wonder why no one likes them? How the market acts today will depend largely on what Comey says to the committee. But remember that Comey has always had a knack to weasel out of any situation. Look at what he did with the election last year...
Author

Nick Mastrandrea
Market Tea Leaves


