Columbus Day Crunch

Good Morning Traders,
As of this writing 4 AM EST, here’s what we see:
US Dollar: Dec. USD is Down at 93.360.
Energies: Nov Crude is Up at 49.71.
Financials: The Dec 30 year bond is Down 2 ticks and trading at 152.01.
Indices: The Dec S&P 500 emini ES contract is 12 ticks Higher and trading at 2546.75.
Gold: The Dec gold contract is trading Up at 1289.80. Gold is 48 ticks Higher than its close.
Initial Conclusion
This is not a correlated market. The dollar is Down- and Crude is Up+ which is normal and the 30 year Bond is trading Lower. The Financials should always correlate with the US dollar such that if the dollar is lower then bonds should follow and vice-versa. The indices are Higher and Crude is trading Up+ which is not correlated. Gold is trading Up which is correlated with the US dollar trading Down-. I tend to believe that Gold has an inverse relationship with the US Dollar as when the US Dollar is down, Gold tends to rise in value and vice-versa. Think of it as a seesaw, when one is up the other should be down. I point this out to you to make you aware that when we don’t have a correlated market, it means something is wrong. As traders you need to be aware of this and proceed with your eyes wide open.
At this hour Asia is trading mainly Higher with the exception of the Singapore exchange which is trading fractionally Lower. As of this writing all of Europe is trading Mixed with half the exchanges Higher and the other half Lower.
Possible Challenges To Traders Today
NFIB Small Business Index is out at 6 AM EST. This is not major.
FOMC Member Kashkari Speaks at 10 AM. This is major.
IBD/TIPP Economic Optimism is out at 10 AM. This is major.
FOMC Member Kaplan Speaks at 8 PM. No impact on session.
Treasuries
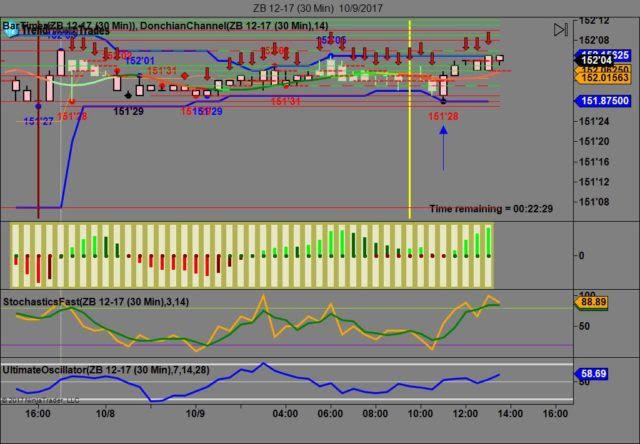
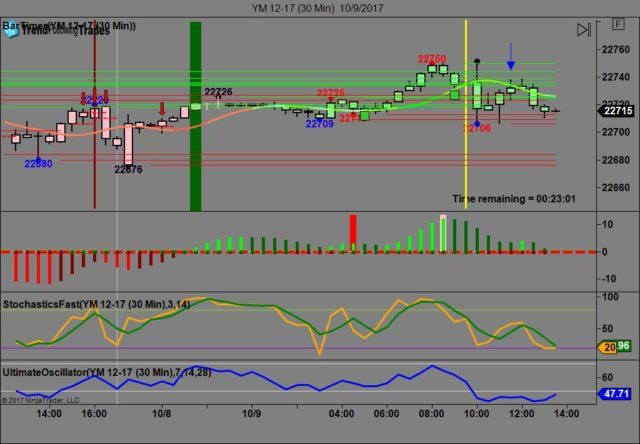
We’ve elected to switch gears a bit and show correlation between the 30 year bond (ZB) and The YM futures contract. The YM contract is the DJIA and the purpose is to show reverse correlation between the two instruments. Remember it’s liken to a seesaw, when up goes up the other should go down and vice versa.
Yesterday the ZB made it’s move at around 11 AM EST with no economic news to speak of. The ZB hit a Low at around that time and the YM hit a High. If you look at the charts below ZB gave a signal at around 11 AM EST and the YM was moving Lower at the same time. Look at the charts below and you’ll see a pattern for both assets. ZB hit a Low at around 11 AM and the YM hit a High. These charts represent the newest version of Trend Following Trades and I’ve changed the timeframe to a 30 minute chart to display better. This represented a Long opportunity on the 30 year bond, as a trader you could have netted about a dozen ticks per contract on this trade. Each tick is worth $31.25. We added a Donchian Channel to the charts to show the signals more clearly. Please note that the front month for the ZB and the YM contract is now December, 2017.
Charts Courtesy of Trend Following Trades built on a NinjaTrader platform.
Bias
Yesterday we maintained a Neutral bias as the indices had no sense of direction yesterday morning but then again it was Columbus Day and the banks were closed which may explain the lack of direction. The Dow dropped 13 points and the other indices lost ground fractionally. Today we aren’t dealing with a correlated market however our bias is to the Upside.
Could this change? Of Course. Remember anything can happen in a volatile market.
Commentary
Yesterday was Columbus Day in the United States which is to say that it is a bank holiday and not all banks were closed. Case in point Wells Fargo was open yesterday for business as a regular business day so go figure. The indices were pretty much all over the maps yesterday as the Dow was up then down then up and down again. Today we do not have a great deal of economic news to bolster the markets by much but Earnings Season will start in earnest for the 3rd calendar quarter.
Author

Nick Mastrandrea
Market Tea Leaves


