|

Coffee Elliott Wave technical analysis [Video]

Coffee Elliott Wave analysis

Coffee breached the May 2011 high that was set over 13 years ago. Thus, with the recent high, the commodity has reached a fresh record high, even surpassing the previous record high set in March 1977. The commodity has gained about 80% in the last 1 year making it one of the most profitable commodities for investors. With the current record rally, where next can this commodity find resistance?

Coffee long term analysis

From the long-term perspective, the all-time chart from the early 70s is sideways/corrective/choppy. After completing a bearish zigzag structure in May 2019, the commodity began another corrective zigzag structure to the upside. From May 2019, the price completed wave W of the cycle degree in February 2022 and then followed by wave X pullback of the same degree in January 2023. 

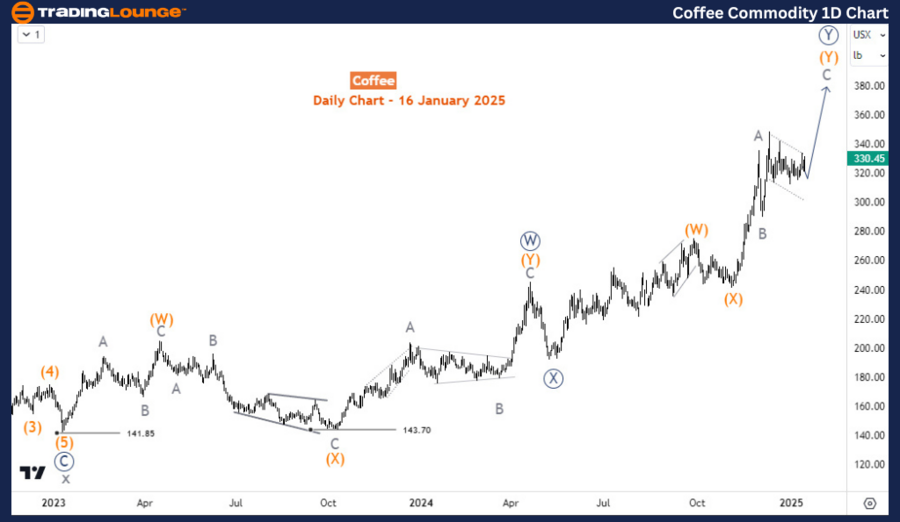
Coffee daily chart analysis

Since January 2023 the cycle degree wave Y has also evolved into a double zigzag structure finishing wave ((W)) and ((X)) in April and May 2024 respectively and now in ((Y)). Within ((Y)) as the daily chart shows, the price completed waves (W) and (X) and is now in wave C of (Y). By extension, we expect wave ((Y)) to finish at 317.65-425. While the price has entered this zone, the structure appears incomplete and thus, we could see the commodity reach 358 or even higher. This means that buyers can still take positions from pullbacks to higher prices.

Coffee

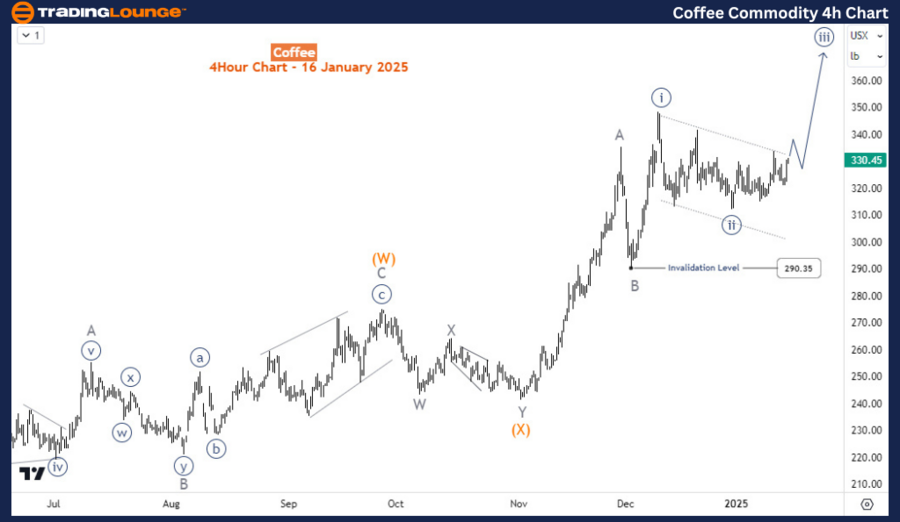
Coffee four-hour chart analysis

On the H4 chart, the price may have finished wave ((ii)) of C or may turn lower in a double zigzag toward 298. However, while 290.35 is not breached, wave ((iii)) should extend to higher prices along the path of wave C of (Y)of ((Y)).

Coffee

Coffee Elliott Wave technical analysis [Video]

Author

Peter Mathers

Peter Mathers

TradingLounge

Peter Mathers started actively trading in 1982. He began his career at Hoei and Shoin, a Japanese futures trading company.

More from Peter Mathers
Share:

Editor's Picks

EUR/USD deflates to multi-week lows near 1.1640

EUR/USD is down for the third straight day on Thursday, coming under extra downside pressure and approaching its transitory 55-day SMA around 1.1640 amid tge persistent recovery in the Greenback. Moving forward, market participants should remain prudent ahead of the release of Friday’s US NFP figures.

GBP/USD: Further weakness could challenge 1.3400

GBP/USD remains under unabated selling pressure on Thursday, slipping to fresh three-day lows around 1.3415 in response to further improvement in the sentiment surrounding the Greenback ahead of Friday’s key NFP data.

Gold edges lower as bulls opt to wait for the crucial US NFP report

Gold struggles to capitalize on the previous day's goodish move up from the vicinity of the $4,400 mark and attracts some sellers during the Asian session on Friday as bulls seem reluctant ahead of the US NFP report. The critical US employment details will offer more cues about the Fed's rate-cut path, which, in turn, will influence the US Dollar price dynamics and provide a fresh impetus to the non-yielding bullion. In the meantime, dovish Fed expectations and rising geopolitical tensions might continue to act as a tailwind for the XAU/USD.

XRP slides as institutional and retail demand falters

Ripple (XRP) is trading down for the third consecutive day on Thursday amid escalating volatility in the cyrptocurrency market. After peaking at $2.41 on Tuesday, its highest print since November 14 amid the early-year rally, XRP has quickly ran into aggressive profit-taking.

2026 economic outlook: Clear skies but don’t unfasten your seatbelts yet

Most years fade into the background as soon as a new one starts. Not 2025: a year of epochal shifts, in which the macroeconomy was the dog that did not bark. What to expect in 2026? The shocks of 2025 will not be undone, but neither will they be repeated.

XRP slides as institutional and retail demand falters

Ripple is trading down for the third consecutive day on Thursday amid escalating volatility in the cyrptocurrency market. After peaking at $2.41 on Tuesday, its highest print since November 14 amid the early-year rally, XRP has quickly ran into aggressive profit-taking.