Cocoa Elliott Wave technical analysis [Video]
![Cocoa Elliott Wave technical analysis [Video]](https://editorial.fxsstatic.com/images/i/Commodities_Cocoa-2_XtraLarge.jpg)
Cocoa Elliott Wave analysis – Daily chart
After encountering a major resistance zone, Cocoa futures are once again under pressure, continuing the bearish correction that began on 18 December 2024. This current wave down is projected to break below the April 2025 low, potentially reaching the 6576–5356 region, extending the correction further.
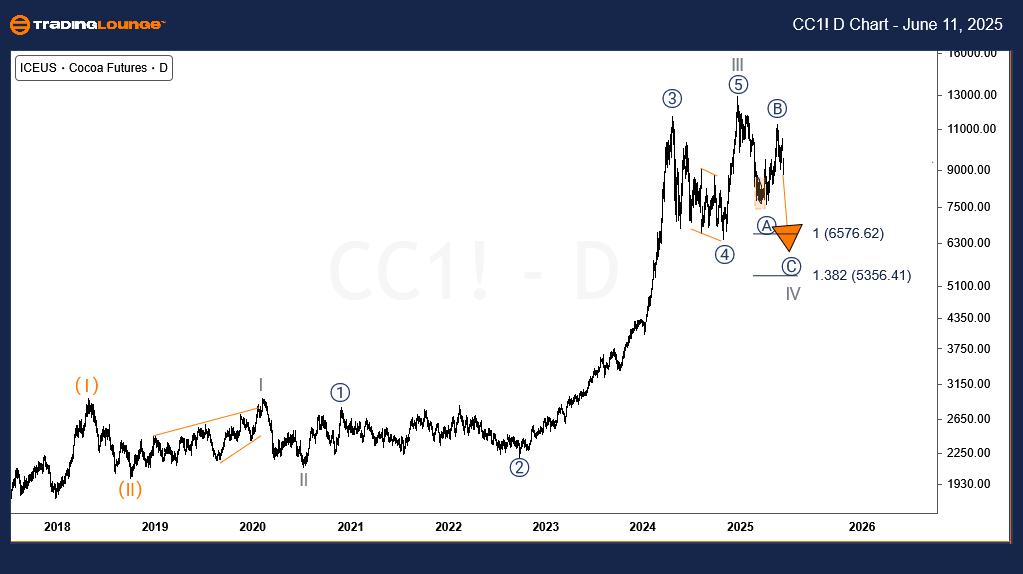
Cocoa long-term Elliott Wave analysis
Cocoa remains bullish in the long term, supported by its historical uptrend that began in April 2017. The current long-term cycle reflects a major Elliott Wave advance, with:
-
Wave (I) completed in April 2018.
-
Wave (II) ended in October 2018.
-
Wave (III) began in October 2018, starting at $2,147 and peaking at $12,931 in December 2024.
This high marked the completion of Wave III of (III), initiating the corrective Wave IV of the major impulse that began in July 2020.
Corrective Wave IV has developed with:
-
Wave ((A)) ending in March 2025.
-
Wave ((B)) finishing in May 2025.
-
Wave ((C)) now underway, with downside projections targeting 6576–5356 (100% of ((A)) measured from ((B))).
This suggests short-term pressure remains bearish, although it is part of a long-term bullish framework.
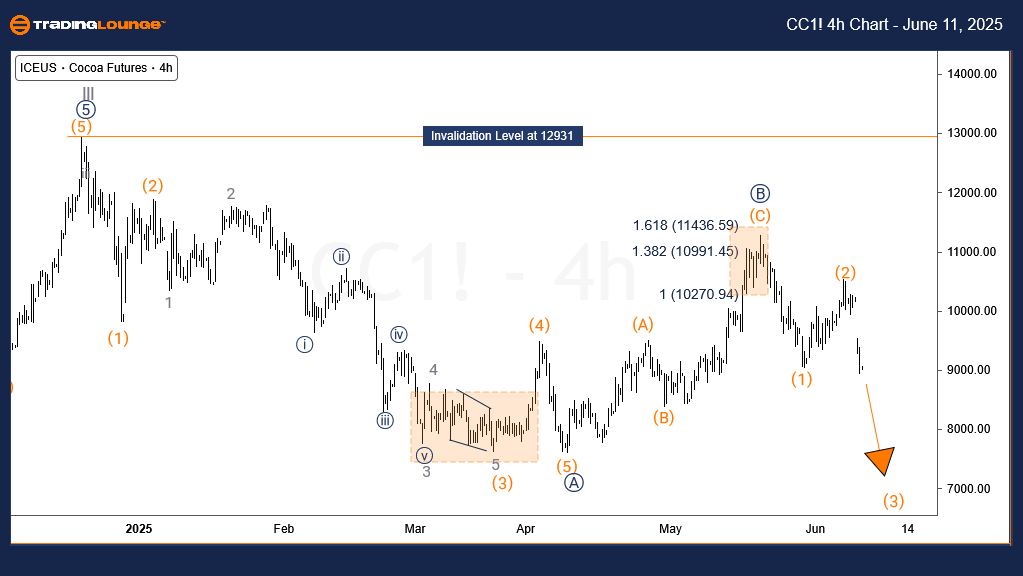
Cocoa Elliott Wave analysis – Four-hour chart
The 4-hour chart zooms in on the internal structure of Wave ((C)), currently unfolding to the downside. So far:
-
Waves (1) and (2) of ((C)) have completed.
-
Price is now developing Wave (3) of ((C)), with projections suggesting a decline to the 7773–7380 region in the near term.
This reinforces the short-term bearish bias within a longer-term correction phase.
Cocoa Elliott Wave technical analysis [Video]
Author

Peter Mathers
TradingLounge
Peter Mathers started actively trading in 1982. He began his career at Hoei and Shoin, a Japanese futures trading company.


