Classic chart pattern stop placements
One of the questions traders often ask is where should I place my stops when I am trading classic chart patterns. A classic chart pattern is a Head & Shoulders pattern, a double top, or a symmetrical triangle etc. This article will not go into recognising these patterns, but instead, it will give you an explanation of where to place your stops.
Now trading, in some ways, is more about managing your risk than necessarily executing your trade. Management trumps execution and a well-managed trade can make up for a multitude of trading sins. The foundation of that management is a stop placement and the amount of your capital risked.
So here is a little resource pointing folks in the right direction.
Where to place the stop?
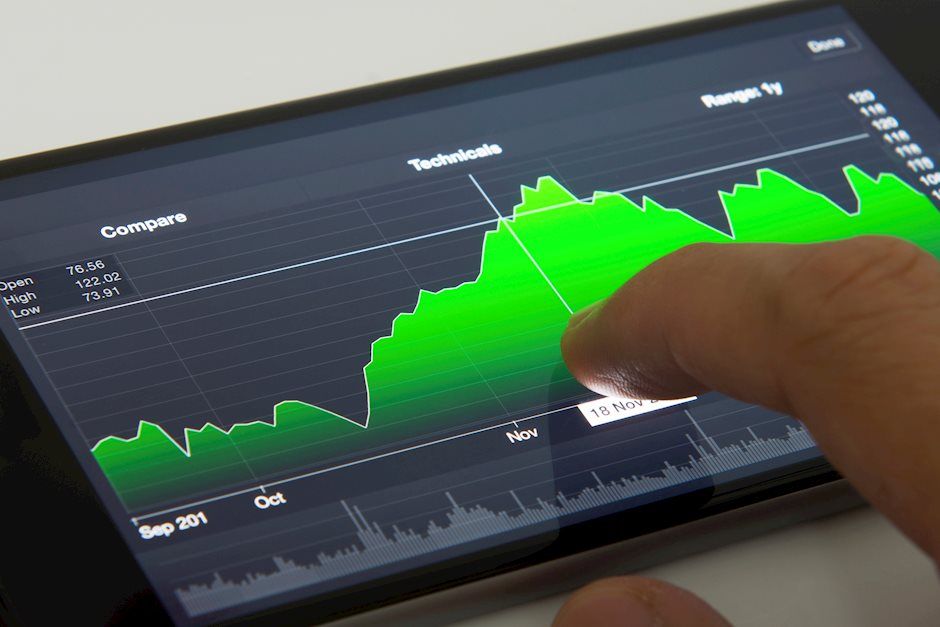
You have three options. Here is an example of a trade taken on the FTSE 100 chart. The fundamental reason for the trade is a fast vaccine roll out in the UK, post-Brexit optimism, some ground to catch up from a post-COVID-19 slump, and a more upbeat UK GDP outlook. All should support the FTSE 100. Therefore, going with a break of the symmetrical triangle should make sense. This trade was the second bite of the cherry as the first breakout resulted in the stop being hit. However, it does serve to show the three options in stop placement.
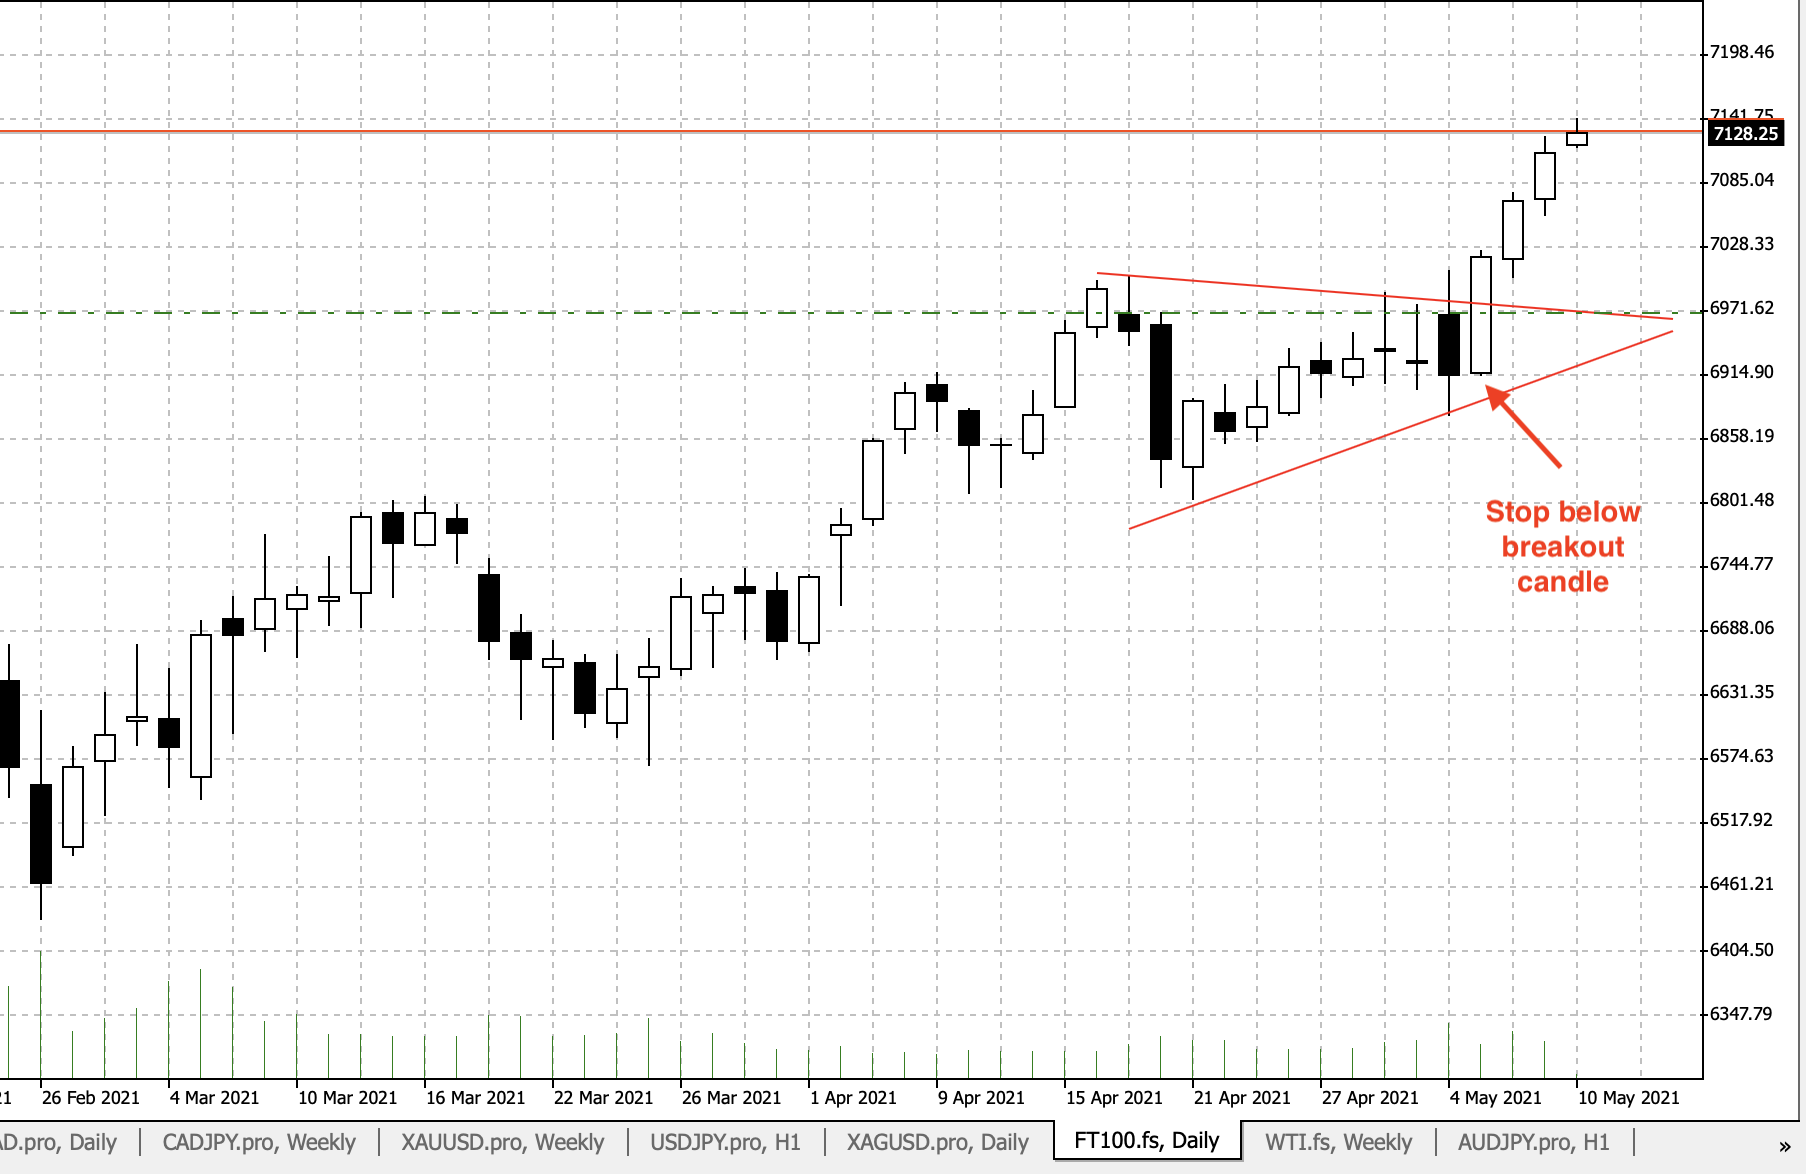
Underneath the breakout candle
The pros of this method is that you can keep the risk to the trade very tight and have a larger position size. The negative? More stop-outs, but you can always re-enter.
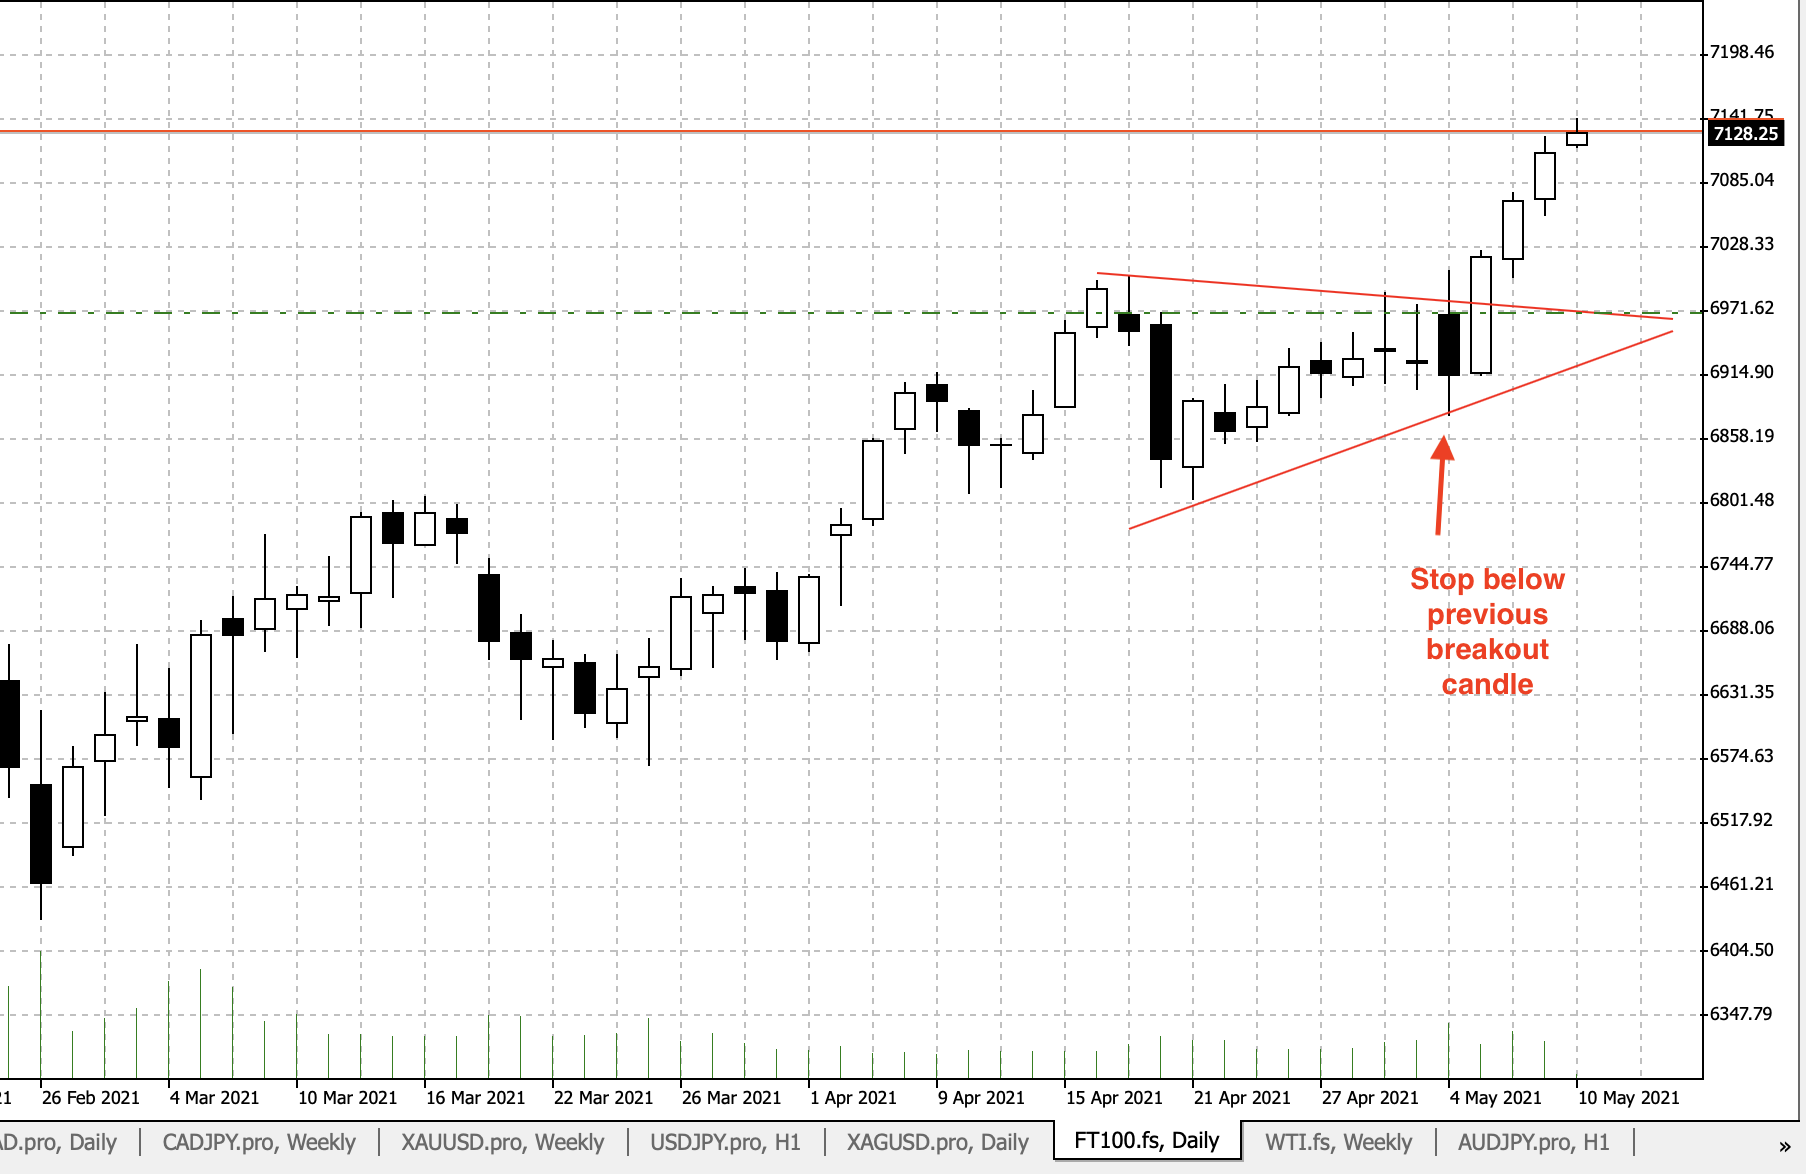
Underneath the low of the candle previous to the breakout candle
Less stop-outs, but smaller position size.
Other side of the pattern and ‘manage your trade’
The least in terms of position size, but the most relaxed in terms of trade management. You can also be a bit pickier on whether you stay in the trade or not. However, too much flexibility can be positive and negative. Yes, you can choose whether to stay in or not, but over-analysis can sometimes lead to paralysis.

Author

Giles Coghlan LLB, Lth, MA
Financial Source
Giles is the chief market analyst for Financial Source. His goal is to help you find simple, high-conviction fundamental trade opportunities. He has regular media presentations being featured in National and International Press.


