China Virus Takes Center Stage

Good Morning Traders,
As of this writing 5 AM EST, here’s what we see:
US Dollar: March USD is Up at 99.510.
Energies: April'20 Crude Down at 51.47.
Financials: The Mar'20 30 year bond is Up 52 ticks and trading at 166.19.
Indices: The March S&P 500 emini ES contract is 328 ticks Lower and trading at 3256.00.
Gold: The April '20 Gold contract is trading Up at 1685.20. Gold is 364 ticks Higher than its close.
Initial Conclusion
This is not a correlated market. The dollar is Up+ and Crude is Down- which is normal and the 30 year Bond is trading Higher. The Financials should always correlate with the US dollar such that if the dollar is lower then bonds should follow and vice-versa. The S&P is Lower and Crude is trading Lower which is not correlated. Gold is trading Higher which is not correlated with the US dollar trading Up. I tend to believe that Gold has an inverse relationship with the US Dollar as when the US Dollar is down, Gold tends to rise in value and vice-versa. Think of it as a seesaw, when one is up the other should be down. I point this out to you to make you aware that when we don't have a correlated market, it means something is wrong. As traders you need to be aware of this and proceed with your eyes wide open.
At this time all of Asia is trading Lower. Currently all of Europe is trading Lower as well.
Possible Challenges To Traders Today:
FOMC Member Mester Speaks at 3 PM EST. This is Major.
No Major economic news to speak of.
Lack of Major economic news.
Treasuries
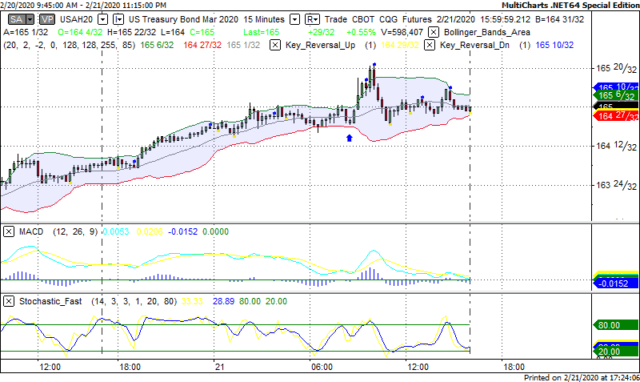
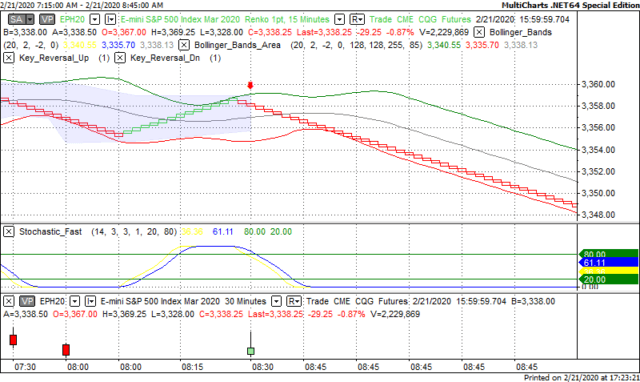
We've elected to switch gears a bit and show correlation between the 30 year bond (ZB) and The S&P futures contract. The S&P contract is the Standard and Poor's and the purpose is to show reverse correlation between the two instruments. Remember it's liken to a seesaw, when up goes up the other should go down and vice versa.
On Friday the ZB made a move at around 8:14 AM EST. The ZB hit a Low at around that time and the S&P moved Lower. If you look at the charts below ZB gave a signal at around 9:30 AM and the S&P moved Lower at the same time. Look at the charts below and you'll see a pattern for both assets. ZB hit a Low at around 8:15 AM EST and the S&P was moving Lower shortly thereafter. These charts represent the newest version of MultiCharts and I've changed the timeframe to a 15 minute chart to display better. This represented a Long opportunity on the 30 year bond, as a trader you could have netted about 20 plus ticks per contract on this trade. Each tick is worth $31.25. Please note: the front month for the ZB is now March '20. The S&P contract is also March '20. I've changed the format to Renko bars such that it may be more apparent and visible.
Charts Courtesy of MultiCharts built on an AMP platform.
Bias
On Friday we gave the markets a Downside bias as the Bonds and Gold were both trading Higher Friday morning and that usually doesn't bode well for an Upside day. The markets didn't disappoint as the Dow dropped 228 points and the other indices lost ground as well. Today we aren't dealing with a correlated market and our bias is to the Downside.
Could this change? Of Course. Remember anything can happen in a volatile market.
Commentary
After reviewing the markets from this past week, it appears that each day we get some positive news regarding the coronavirus from China, the market go up. However when companies are now saying that the coronavirus will have a negative impact on earnings, that doesn't bode well for the markets and the indices drop. I never thought we'd ever see the day when a contagious virus can have such an impact on both US and global markets, but here it is. Will this change over time? We certainly hope so and trust that this situation will be deemed as "overblown" but as in all things, only time will tell.
Author

Nick Mastrandrea
Market Tea Leaves


