China Tariffs Torpedo Markets

As of this writing 5:50 AM EST, here’s what we see:
US Dollar: Sept USD is Down at 97.305.
Energies: Sept '19 Crude is Up at 54.90.
Financials: The Sept 30 year bond is Down 12 ticks and trading at 160.11.
Indices: The Sept S&P 500 emini ES contract is 117 ticks Higher and trading at 2859.25.
Gold: The Dec Gold contract is trading Down at 1473.70. Gold is 27 ticks Lower than its close.
Initial Conclusion
This is not a correlated market. The dollar is Down- and Crude is Up+ which is normal and the 30 year Bond is trading Lower. The Financials should always correlate with the US dollar such that if the dollar is lower then bonds should follow and vice-versa. The S&P is Higher and Crude is trading Higher which is not correlated. Gold is trading Lower which is not correlated with the US dollar trading Down. I tend to believe that Gold has an inverse relationship with the US Dollar as when the US Dollar is down, Gold tends to rise in value and vice-versa. Think of it as a seesaw, when one is up the other should be down. I point this out to you to make you aware that when we don't have a correlated market, it means something is wrong. As traders you need to be aware of this and proceed with your eyes wide open.
Currently all of Asia is trading to the Downside with the exception of the Indian Sensex. At this time all of Europe is trading to the Upside.
Possible Challenges To Traders Today
-
JOLTS Job Openings is out at 10 AM EST. This is major
-
IBD/TIPP Economic Optimism is out at 10 AM EST. This is major.
-
FOMC Member Bullard Speaks at 12 noon EST. This is major.
Treasuries
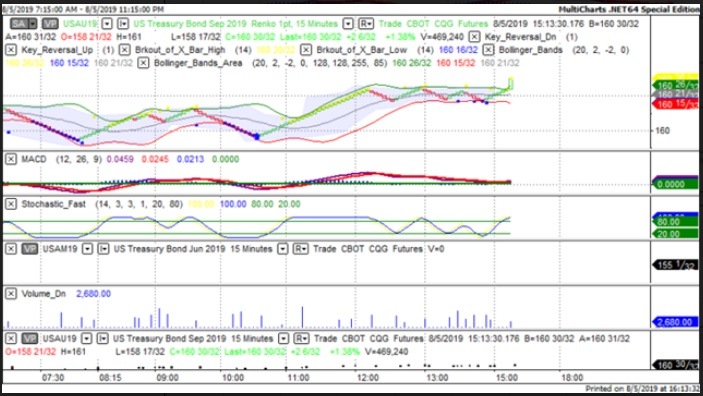
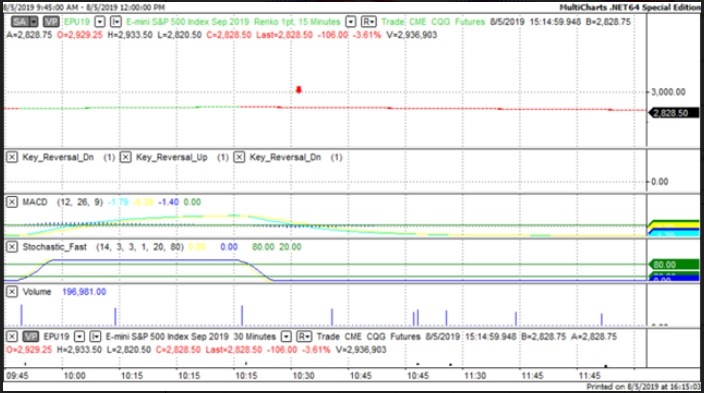
We've elected to switch gears a bit and show correlation between the 30 year bond (ZB) and The YM futures contract. The YM contract is the DJIA and the purpose is to show reverse correlation between the two instruments. Remember it's liken to a seesaw, when up goes up the other should go down and vice versa.
Yesterday the ZB made a major move at around 10:30 AM EST. The ZB hit a Low at around that time and the YM hit a High. If you look at the charts below ZB gave a signal at around 10:30 AM EST and the YM was moving Lower at the same time. Look at the charts below and you'll see a pattern for both assets. ZB hit a Low at around 10:30 AM and the YM was moving Lower at the same time. These charts represent the newest version of MultiCharts and I've changed the timeframe to a 15 minute chart to display better. This represented a Long opportunity on the 30 year bond, as a trader you could have netted about 30 plus ticks per contract on this trade. Each tick is worth $31.25. Please note: the front month for both the ZB and YM contract is now September, 2019 and I've changed the format to Renko bars such that it may be more apparent and visible.
Charts Courtesy of MultiCharts built on an AMP platform.
Bias
Yesterday we gave the markets a Downside bias as the Bonds and Gold were trading at nearly sky high levels. The markets didn't disappoint as the Dow fell 767 points and the other indices lost ground as well. Today we aren't dealing with a correlated market and our bias is to the Upside.
Could this change? Of Course. Remember anything can happen in a volatile market.
Commentary
Thursday evening we first heard that the Trump Administration was going to charge a 10% tariff on goods imported from China that heretofore weren't subject to a tariff. Whereas this did have a negative effect on Friday, by yesterday it turned into a full fledged tsunami. The Dow dropped by 767 points marking the worst trading day of 2019. Apparently the Smart Money is concerned that this will lead to a trade war with China and will result in inflation for the US. No one wants that as it will alert the Federal Reserve to perhaps start raising rates again. This plus the tragic shootings in both El Paso, Texas and Dayton , Ohio did not make for much of a trading day.
Author

Nick Mastrandrea
Market Tea Leaves


