China Syndrome Strikes Again [Video]
![China Syndrome Strikes Again [Video]](https://editorial.fxstreet.com/images/Macroeconomics/Countries/Asia/China/blue-sky-and-white-clouds-ancient-chinese-architecture-43407474_XtraLarge.jpg)
US Dollar: Dec USD is Down at 98.575.
Energies: Nov '19 Crude is Up at 52.82.
Financials: The Dec 30 year bond is Down 5 ticks and trading at 164.08.
Indices: The Dec S&P 500 emini ES contract is 6 ticks Lower and trading at 2936.00.
Gold: The Dec Gold contract is trading Down at 1503.20. Gold is 16 ticks Lower than its close.
Initial Conclusion
This is not a correlated market. The dollar is Down- and Crude is Up+ which is normal and the 30 year Bond is trading Lower. The Financials should always correlate with the US dollar such that if the dollar is lower then bonds should follow and vice-versa. The S&P is Lower and Crude is trading Higher which is correlated. Gold is trading Lower which is not correlated with the US dollar trading Down. I tend to believe that Gold has an inverse relationship with the US Dollar as when the US Dollar is down, Gold tends to rise in value and vice-versa. Think of it as a seesaw, when one is up the other should be down. I point this out to you to make you aware that when we don't have a correlated market, it means something is wrong. As traders you need to be aware of this and proceed with your eyes wide open.
At this time Asia is trading Higher with the exception of the Indian Sensex which is Lower. Conversely all of Europe is trading Lower with the exception of the London exchanges which is fractionally Higher at this time.
Possible Challenges To Traders Today
-
NFIB Small Business Index is out at 6 AM EST. This is major.
-
Core PPI m/m is out at 8:30 AM EST. This is major.
-
PPI is out at 8:30 AM EST. This is major.
-
IBD/TIPP Economic Optimism is out at 8:30 AM EST. This is major.
-
FOMC Member Evans Speaks at 1:35 PM. This is major.
-
Fed Chair Powell Speaks at 1:50 PM. This is major.
Treasuries
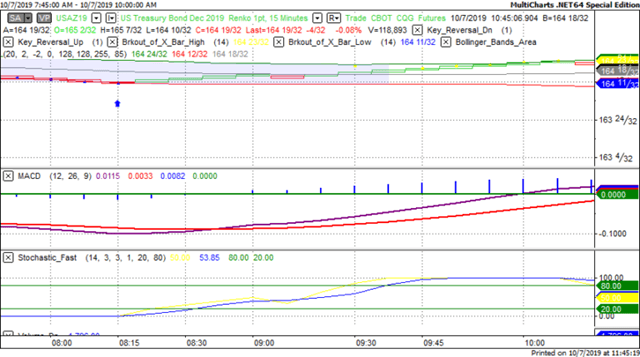
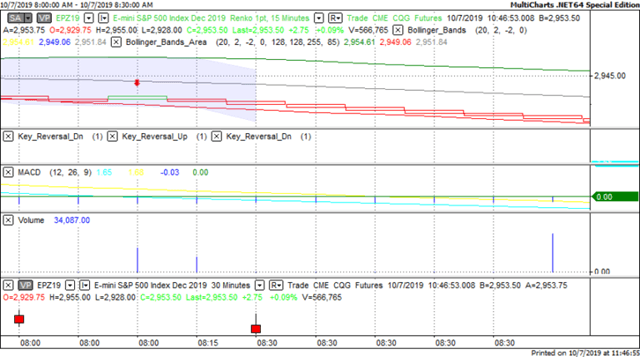
We've elected to switch gears a bit and show correlation between the 30 year bond (ZB) and The YM futures contract. The YM contract is the DJIA and the purpose is to show reverse correlation between the two instruments. Remember it's liken to a seesaw, when up goes up the other should go down and vice versa.
Yesterday the ZB made a major move at around 8 AM EST. The ZB hit a Low at around that time and the S&P hit a High. If you look at the charts below ZB gave a signal at around 8 AM EST and the S&P was moving Lower at the same time. Look at the charts below and you'll see a pattern for both assets. ZB hit a Low at around 8 AM and the S&P was moving Lower at the same time. These charts represent the newest version of MultiCharts and I've changed the timeframe to a 15 minute chart to display better. This represented a Long opportunity on the 30 year bond, as a trader you could have netted about a dozen ticks per contract on this trade. Each tick is worth $31.25. Please note: the front month for the ZB is now December. The S&P contract is now at December as well and I've changed the format to Renko bars such that it may be more apparent and visible.
Charts Courtesy of MultiCharts built on an AMP platform
Bias
Yesterday we gave the markets a Neutral bias as we didn't see any signs of correlation whatsoever. The Dow dropped 96 points and the other indices lost ground as well. Today we aren't dealing wit a correlated market and our bias is Neutral.
Could this change? Of Course. Remember anything can happen in a volatile market.
Commentary
So it seems as though traders and the markets are now concerned over the upcoming visit by the Chinese regarding trade talks. China will be sending their second in command and has made it clear that there is to be no discussions regarding human rights in China or the lack thereof. This has been a hot topic for this Administration so time will tell how it all works out. I guess the markets acre concerned over what President Trump reaction will be to this. We believe the visit is scheduled later this week.
Author

Nick Mastrandrea
Market Tea Leaves


