CHF/JPY has been bullish on the daily chart. The chart produced a bullish marubozu candle yesterday, which closed above a daily resistance. The breakout may attract the buyers to look for long opportunities and push the price towards the North further. Major intraday charts are bullish biased, but they may consolidate before making the next bullish move. Let us have a look at the Daily- CHF/JPY Chart.


Chart 1 CHF/JPY Daily Chart

CHFJPY

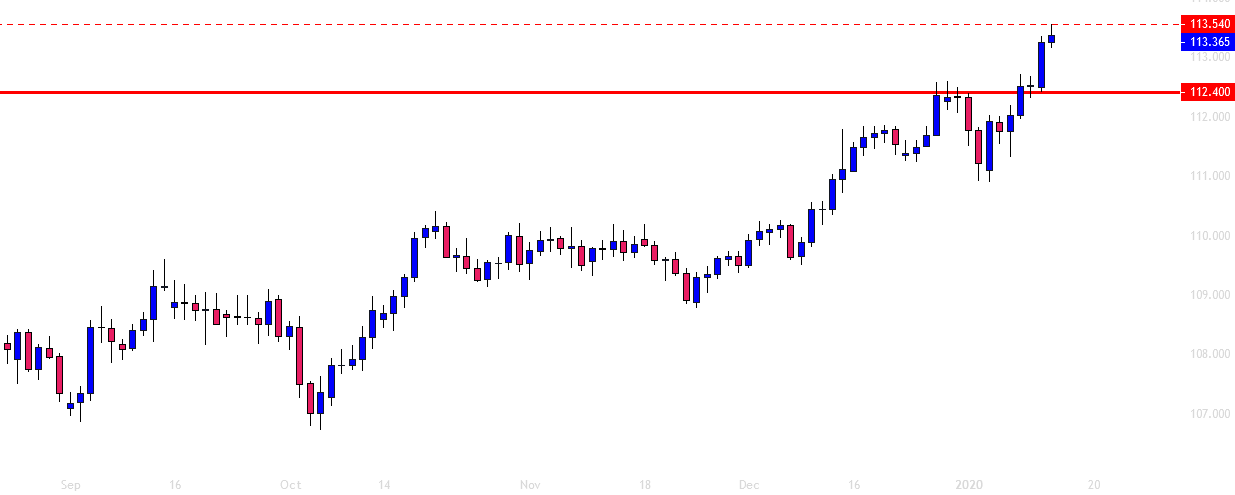
The chart shows that the price made a breakout around the level of 112.400. Since the breakout took place right at the level of support, some buyers may wait for the price to be held by the level of support. However, the candle closed well above the breakout level, so any intraday breakout at yesterday's highest high may make the buyers look for long opportunities. The price may find its next resistance at the level of 114.550 on the daily chart.


Chart 2 CHF/JPY H4 Chart

CHFJPY

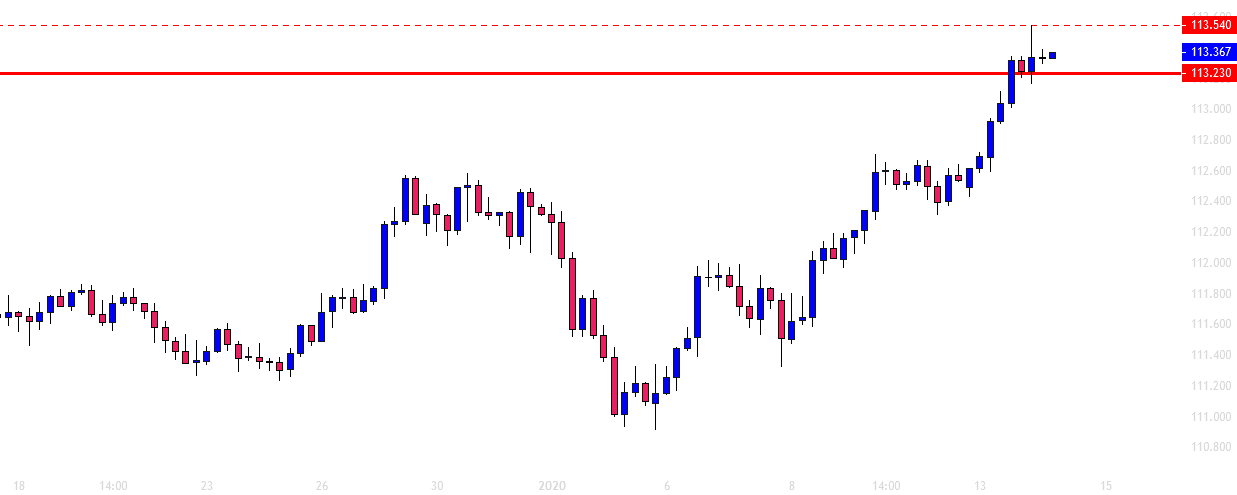
The H4 chart shows that the price has kept making new higher highs. After having a rejection, it produced a bullish candle having a long upper spike. This may make the pair consolidate more. The level of 113.230 may come as a level of support and push the price towards the North. If the price makes a bullish breakout at the level of 113.540, it may find its next resistance at the level of 113.945. On the other hand, if the price makes a bearish breakout at the level of support, it may find its next support at the level of 112.640.


Chart 2 CHF/JPY H1 Chart

CHFJPY

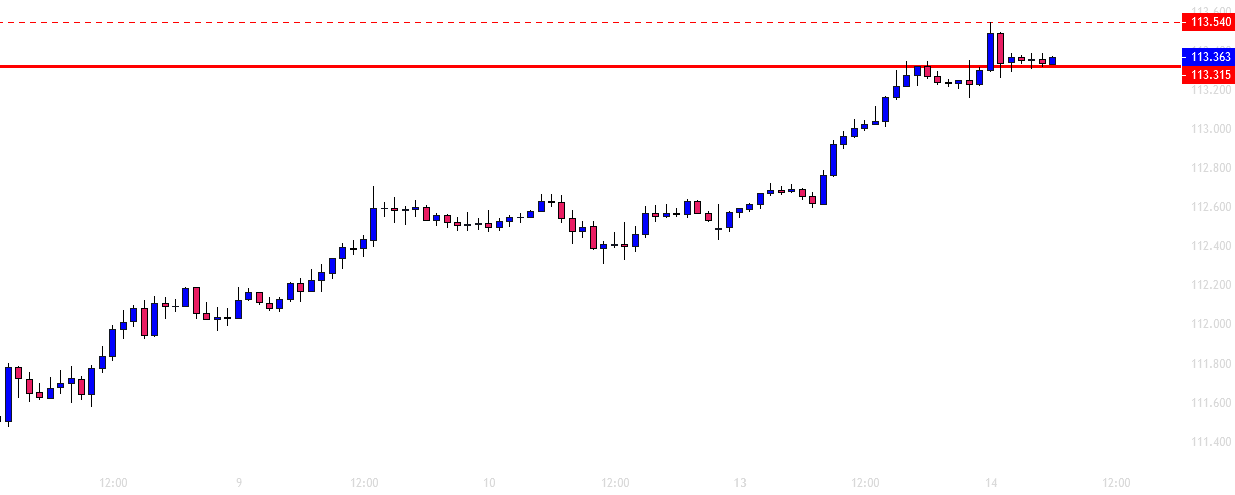
The H4 chart looks bullish biased. However, a lot depends on the level of 113.315. If the level holds the price and produces a bullish reversal candle, the buyers may go long above the level of 113.540. The chart shows that the price has been around the level for quite a while. If it makes a bearish breakout, the sellers may go short on the pair and drive the price towards the level of 112.640. This is a potential level of support on the H4 chart as well. The sellers may keep their eyes on the H1 chart. However, the daily and the H4 chart are bullish biased. Thus, the H1 chart may get bullish and push the price towards the upside. Considering all these factors, the bull may continue its journey and end up producing another daily bullish candle.


Try Secure Leveraged Trading with EagleFX!

Risk Warning: CFD and Spot Forex trading both come with a high degree of risk. You must be prepared to sustain a total loss of any funds deposited with us, as well as any additional losses, charges, or other costs we incur in recovering any payment from you. Given the possibility of losing more than your entire investment, speculation in certain investments should only be conducted with risk capital funds that if lost will not significantly affect your personal or institution’s financial well-being. Before deciding to trade the products offered by us, you should carefully consider your objectives, financial situation, needs and level of experience. You should also be aware of all the risks associated with trading on margin.

Recommended Content


Recommended Content

Editors’ Picks

AUD/USD jumps above 0.6500 after hot Australian CPI data

AUD/USD jumps above 0.6500 after hot Australian CPI data

AUD/USD extended gains and recaptured 0.6500 in Asian trading, following the release of hotter-than-expected Australian inflation data. The Australian CPI rose 1% in QoQ in Q1 against 0.8% forecast, providing extra legs to the Australian Dollar upside. 

AUD/USD News

USD/JPY hangs near 34-year high at 154.88 as intervention risks loom

USD/JPY hangs near 34-year high at 154.88 as intervention risks loom

USD/JPY is sitting at a multi-decade high of 154.88 reached on Tuesday. Traders refrain from placing fresh bets on the pair as Japan's FX intervention risks loom. Broad US Dollar weakness also caps the upside in the major. US Durable Goods data are next on tap. 

USD/JPY News

Gold price cautious despite weaker US Dollar and falling US yields

Gold price cautious despite weaker US Dollar and falling US yields

Gold retreats modestly after failing to sustain gains despite fall in US Treasury yields, weaker US Dollar. XAU/USD struggles to capitalize following release of weaker-than-expected S&P Global PMIs, fueling speculation about potential Fed rate cuts.

Gold News

Crypto community reacts as BRICS considers launching stablecoin for international trade settlement

Crypto community reacts as BRICS considers launching stablecoin for international trade settlement

BRICS is intensifying efforts to reduce its reliance on the US dollar after plans for its stablecoin effort surfaced online on Tuesday. Most people expect the stablecoin to be backed by gold, considering BRICS nations have been accumulating large holdings of the commodity.

Read more

US versus the Eurozone: Inflation divergence causes monetary desynchronization

US versus the Eurozone: Inflation divergence causes monetary desynchronization

Historically there is a very close correlation between changes in US Treasury yields and German Bund yields. This is relevant at the current juncture, considering that the recent hawkish twist in the tone of the Fed might continue to push US long-term interest rates higher and put upward pressure on bond yields in the Eurozone.

Read more

Majors

Cryptocurrencies

Signatures