|

Chart of the week: Oil prices spiking and intent on 2019 highs

  • Bulls in control due to the conflict in the Middle East between Iran and the US.
  • The price action is bullish in the short term charts following a 50% mean reversion of a breakout from the 200-hour moving average. 
  • The daily outlook targets the 2019 highs initially and tougher resistance higher up through 69.60.

Following the escalations of tensions between the US and Iran and the US drone strike on Qassem Soleimani, head of Iran's elite Quds, oil prices are moving higher and are set to target the 2019 highs ahead of key resistance

WTI daily chart

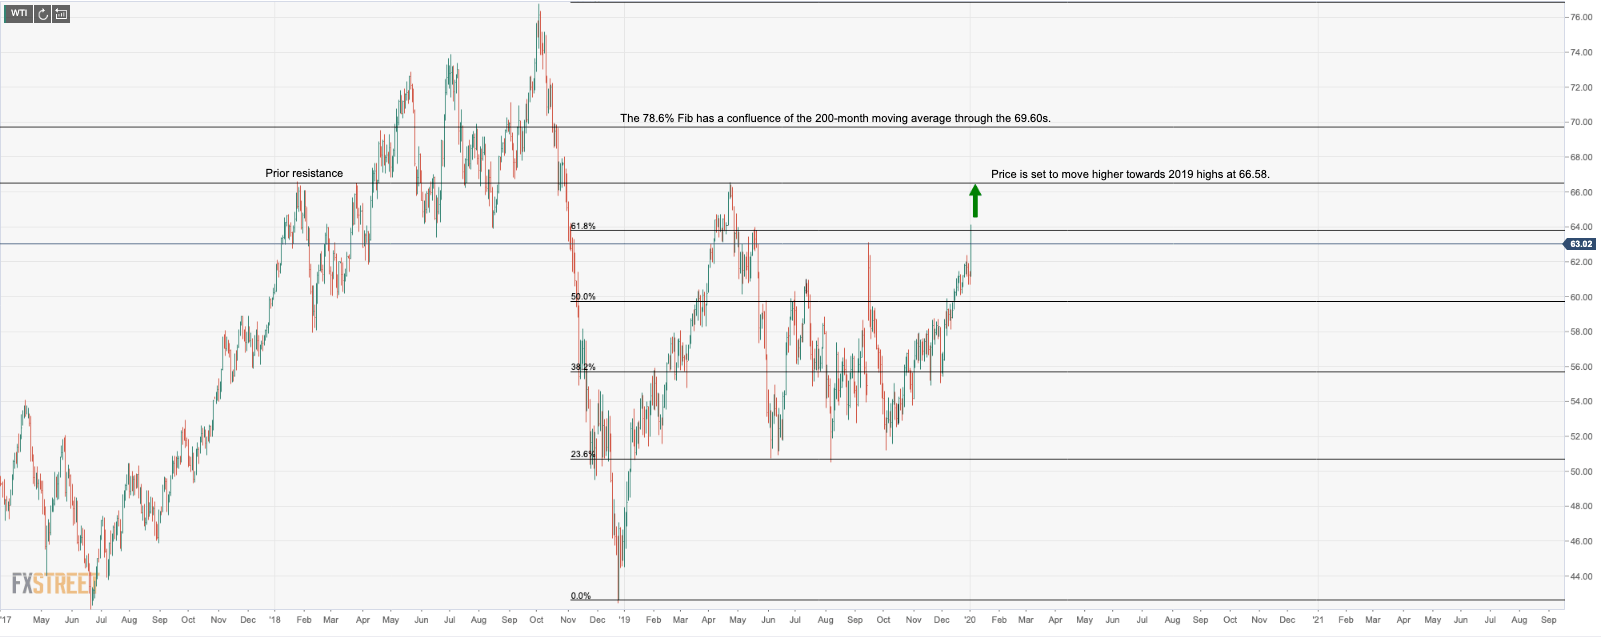
  • The price of oil surged to a fresh eight-month high last week.
  • Bulls can target a break of the 61.8%% Fibonacci retracement of the October to Dec lows.
  • Price is set to move higher towards 2019 highs at 66.58.
  • The 78.6% Fib has a confluence of the 200-month moving average through the 69.60s.
  • 76.88 Oct 2018 highs has a confluence with Sep 2011 lows/summer 2006 highs which could prove to be a tough resistance.

WTI hourly chart

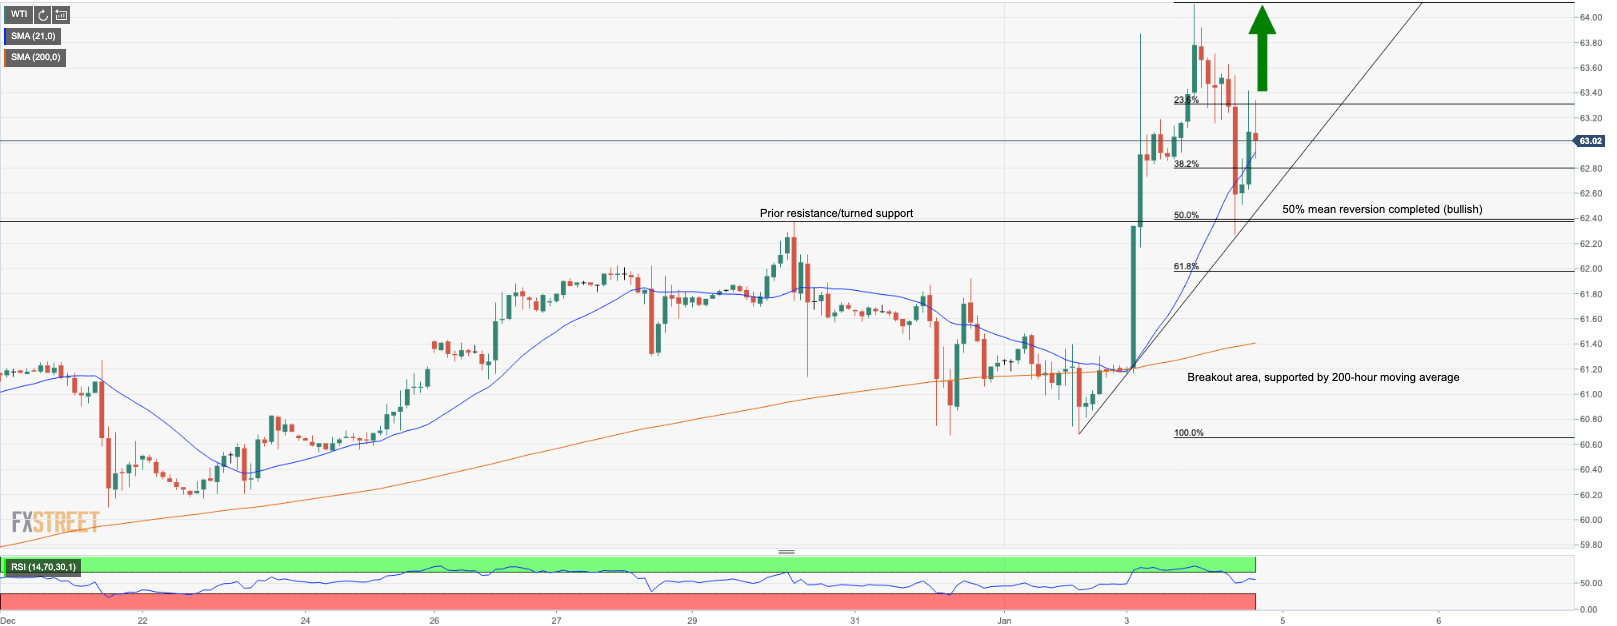
  • The price is a constructive bid holding above 21-hour moving average and trendline support.
  • RSI is below overbought territory although holds above 50 as price is supported at a 50% mean reversion.
  • Support comes at a prior resistance level with the confluence of a 50% Fibonacci retracement of the breakout at the 200-hour moving average. 

Author

Ross J Burland

Ross J Burland, born in England, UK, is a sportsman at heart. He played Rugby and Judo for his county, Kent and the South East of England Rugby team.

More from Ross J Burland
Share:

Editor's Picks

EUR/USD holds above 1.1750 after mixed EU PMI data

EUR/USD manages to hold above 1.1750 but struggles to gather recovery momentum on Friday, following the mixed February PMI figures from Germany and the Eurozone. In the second half of the day, Q4 GDP, December inflation and February PMI data from the US will be watched closely by market participants.

GBP/USD recovers further toward 1.3500 after UK PMI data

GBP/USD is recovering ground further toward 1.3500 in European trading on Friday, helped by a modest uptick in the Pound Sterling after stronger-than-expected UK January Retail Sales and February PMI data. However, the pair's further upside could be limited amid persistent US Dollar strength as the focus turns to key US data. 

Gold sticks to positive bias above $5,000 ahead of US data

Gold gains some positive traction for the third consecutive day on Friday. holding above $5,000. Traders now look forward to the key US macro releases – the Advance Q4 GDP report and the Personal Consumption Expenditures (PCE) Price Index – for fresh trading impetus. 

US GDP growth expected to slow down significantly in Q4 after stellar Q3 

The United States Bureau of Economic Analysis will publish the first preliminary estimate of the fourth-quarter Gross Domestic Product at 13:30 GMT. Analysts forecast the US economy to have expanded at a 3% annualized rate, slowing down from the 4.4% growth posted in the previous quarter.

Iran tensions and AI fears at the forefront ahead of key US data

Thursday’s scorecard shows major US Stock benchmarks closed modestly in the red amid mounting US-Iran tensions and AI disruption worries. The S&P 500 shed 19 points (0.3%) to 6,861, the Nasdaq 100 lost 101 points (0.4%) to 24,797, and the Dow Jones Industrial Average dropped 267 points (0.5%) to 49,395.

Official Trump price approaches breakout with mixed signals from traders

Official Trump (TRUMP) is trading at $3.50 at the time of writing, approaching its upper consolidation range. A breakout from this range could open the door for an upside move. On-chain data shows market indecision, with balanced flows between bulls and bears, signaling a lack of clear directional bias.