Chart of the Week, Gold: XAU/USD is pressured for the open
- Gold is under pressure to start the week but the demand area is solid.
- The market awaits a catalyst to push the price beyond 1,950 for the week ahead.
- XAU/USD to remain bearish amid rising US yields

As for the technical picture, the following illustrates prospects of a breakout to the upside considering the monthly bullish close and wick.
Gold, monthly chart
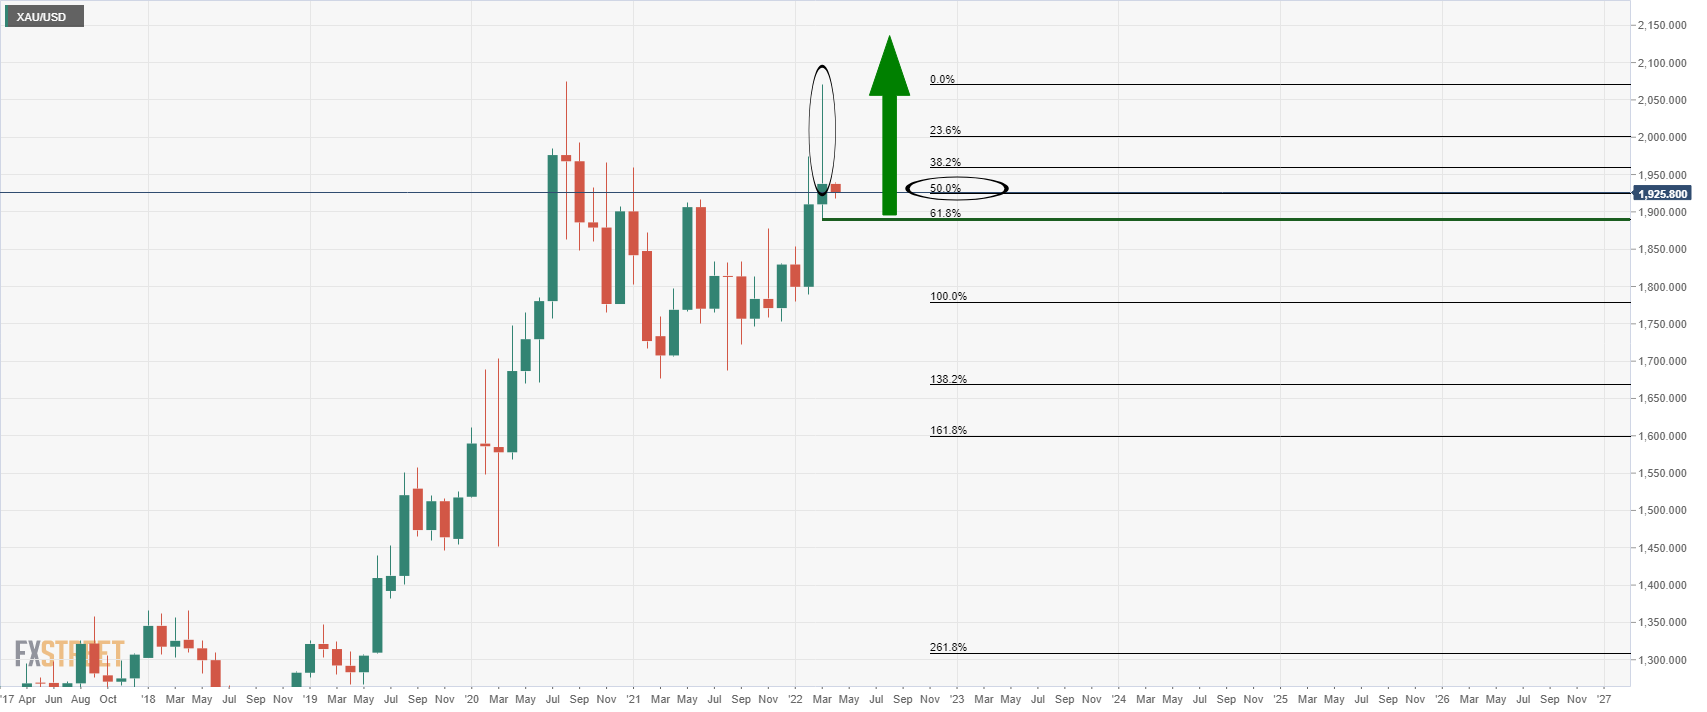
The wick represents the correction of price on the lower time frames. More often than not, once an impulse has been corrected, it attracts demand, in the case of a bullish impulse and higher close. In this case, we have seen the price correct to a 50% mean reversion. There is room, however, for a deeper correction to test the golden ratio, 61.8% Fibonacci at the March lows prior to a move higher again.
Gold weekly chart
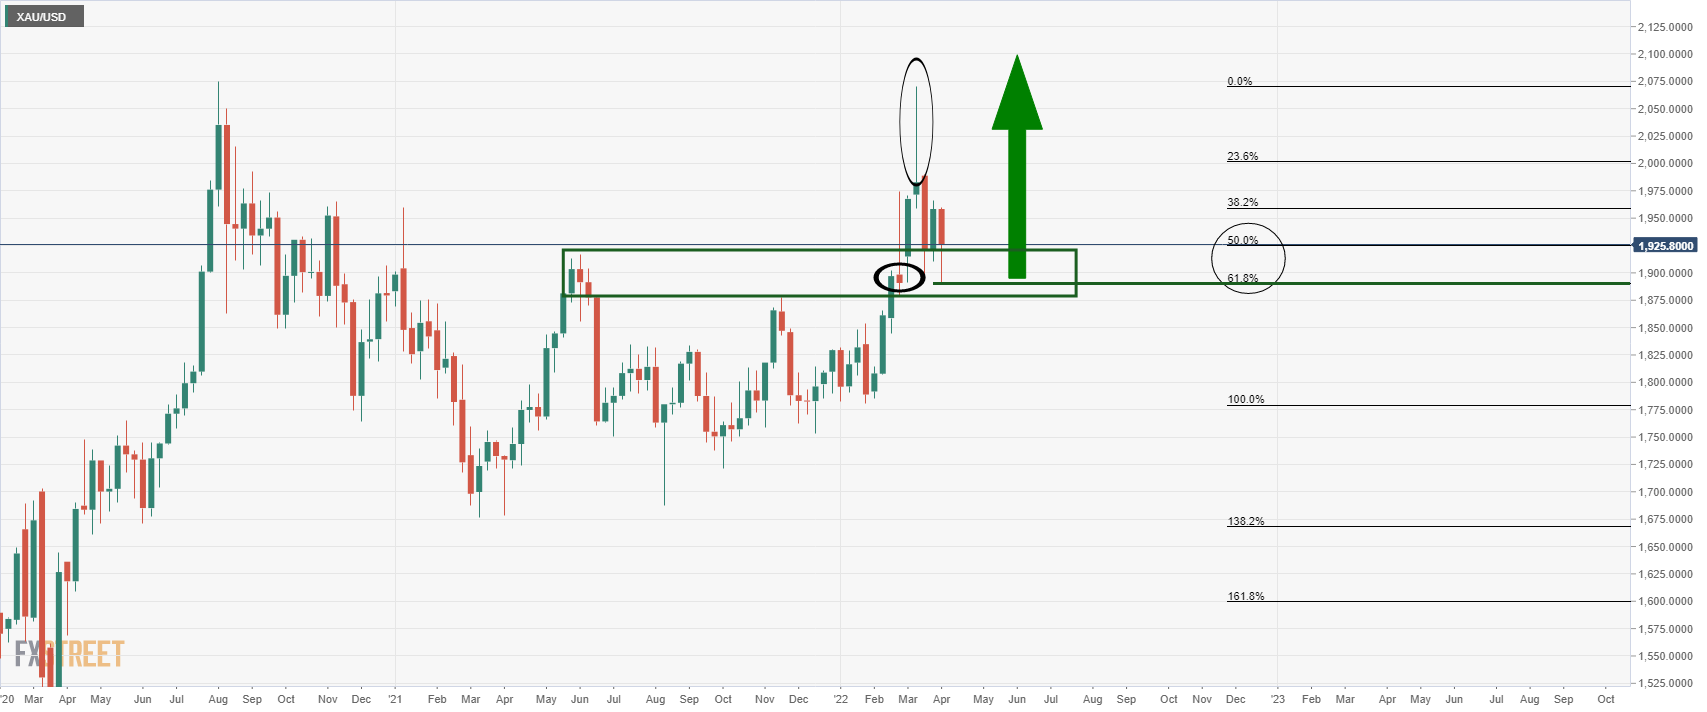
However, from a weekly perspective, there would appear to be strong support around the 61.8% and 50% ratios that coincide with prior resistance across the timeline.
Gold, daily chart
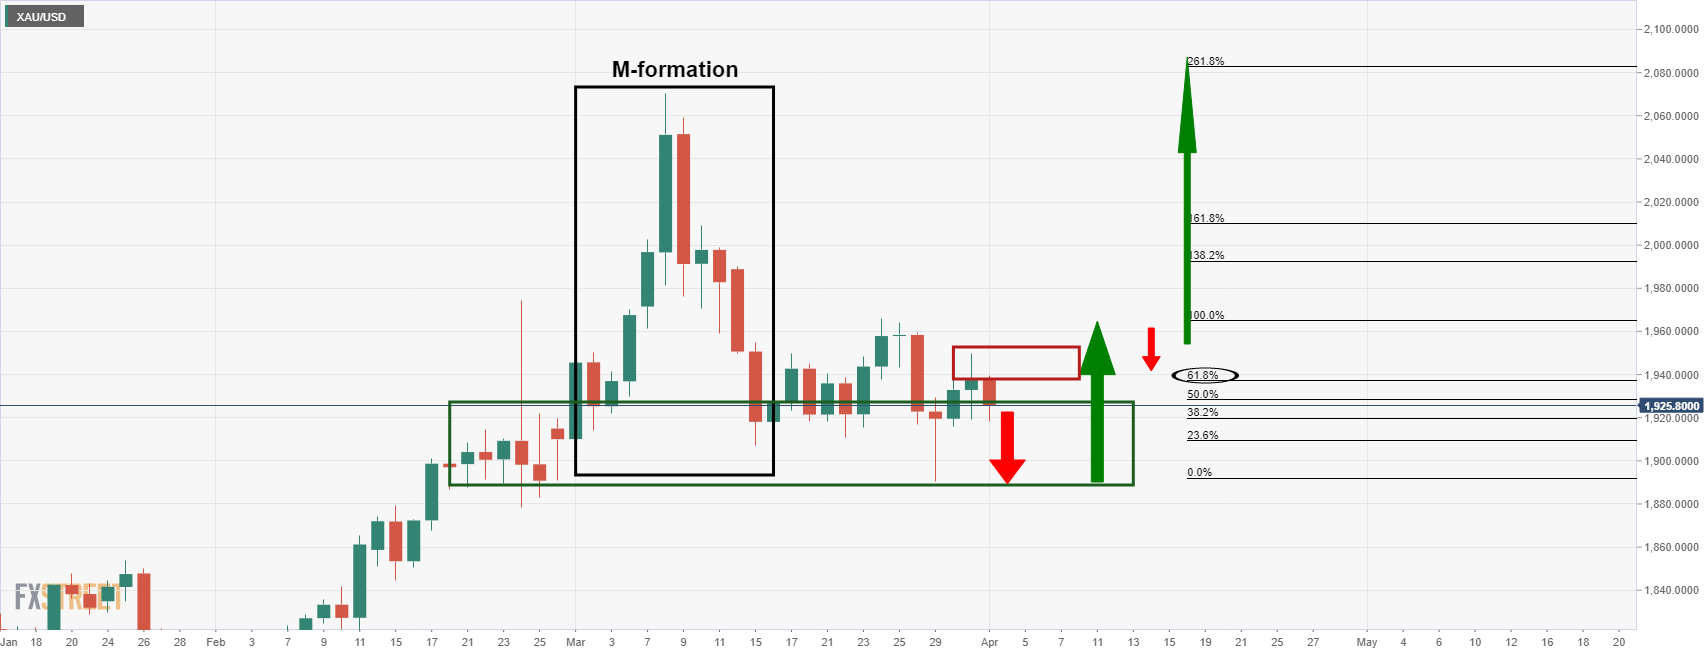
The daily chart is more complex. The M-formation is a bullish reversion pattern and the price would be expected to be attracted to the neckline between 1,980 and 2,000. However, the sideways consolidation has played out to the point that there appears to be a bias to the downside for the near term where gold is being resisted by a 61.8% Fibo currently. With that being said, should the bulls continue to commit in the support area between here and 1,890, then the next fundamental catalyst could tip the balance in favour of the bulls and see the bullish breakout above 1,950 for the week ahead.
Author

Ross J Burland
FXStreet
Ross J Burland, born in England, UK, is a sportsman at heart. He played Rugby and Judo for his county, Kent and the South East of England Rugby team.


