Chart of the Week, Gold Price: Halloween comes early, XAU/USD back below critical bearish structure $,1670
- Gold was back under pressure and there could be far more downside to come.
- All will depend on whether the US dollar can continue on its northerly flight trajectory, now pressing on towards 2002 levels.

It was an eventful week wending October 14, with so much blood being spilt in markets that it felt like Halloween might have come early. Wall Street ended a volatile week on a serious down note as investors worry that the Federal Reserve's interest rate path will throw the US economy, and the world's with it, into a massive downturn.
A sea of blood on Wall Street
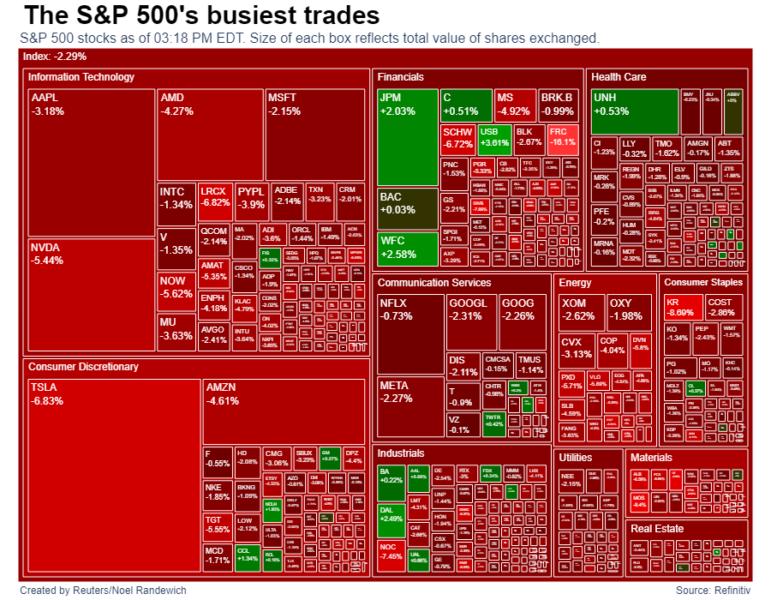
Pulled from an article written by Noel Randewich at Reuters, we can see just how grim Friday ended on Wall Street led by the tech-related heavyweights such as Tesla which dropped some 8%.
The moves come amid the reversal of a bizarre outcome following the prior day's Consumer Price Index data that sparked an initial risk-off knee-jerk reaction that flipped on a dime and led to a drop in the US dollar and yields and a rally on Wall Street. However, Friday reversed the moves and came back more in line with the red-hot inflation narrative and the subsequent negative implications for the US and wider global economies. Both the greenback and US Treasury yields on Friday edged higher as the market comes to terms with the likelihood that interest rates will stay higher for longer.
In fact, individual investor optimism over the short-term direction of the US stock market recorded one of its 60 lowest readings in history in the latest American Association of Individual Investors (AAII) Sentiment Survey, while pessimism rose slightly, Karen Brettell at Reuters reported. ''Bearish sentiment, or expectations that stock prices will fall over the next six months, rose by 1.2 percentage points to 55.9%. Pessimism is above its historical average of 30.5% for the 46th time out of the past 47 weeks and is at "an unusually high level for the 31st time out of the last 39 weeks''
When you throw in the geopolitical risks along with all the global dollar-denominated debt into the mix, the US dollar milkshake theory, a term coined by Brent Johnson, to express the vortex of the greenback, stands to reason.
The path of gold this week will depend hugely on risk sentiment and the direction of the US dollar and yields.
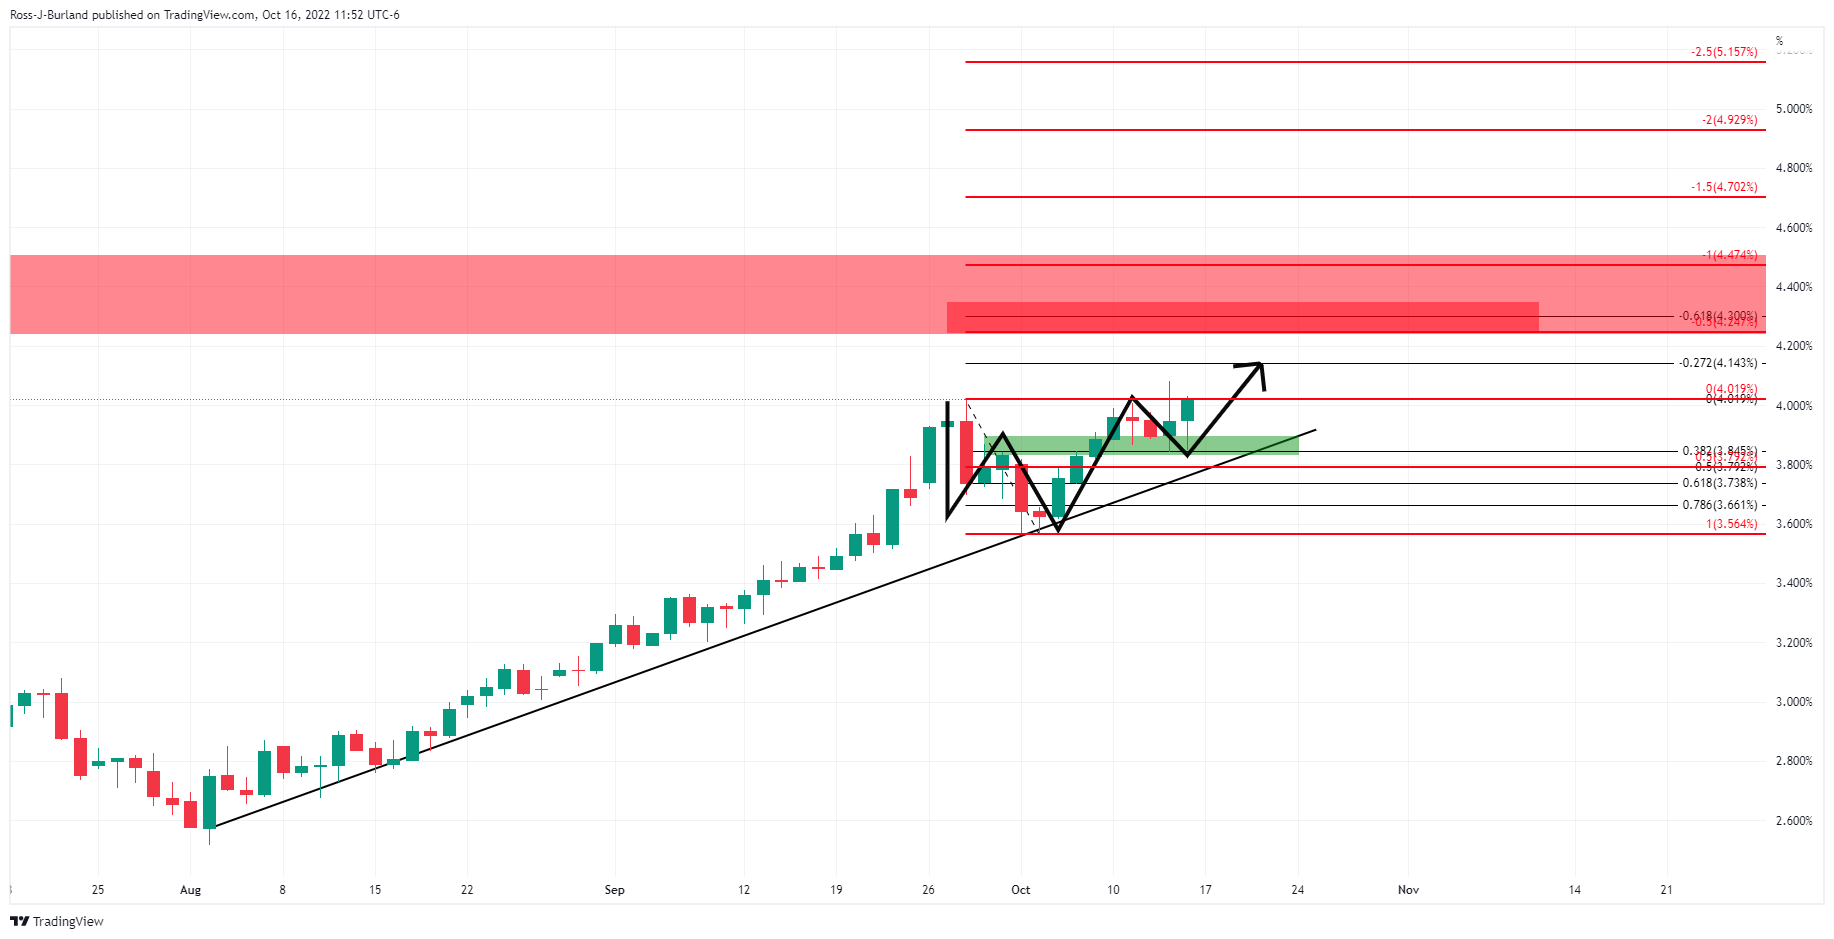
US 10-year yields
They say that the bond markets don't lie. The 10-year yield may have only just gotten started following last week's test of 4%. The W-formation is bullish and the yield still has some ways to go according to the Fibonacci measurement of the 28 Seo- 4 Oct correction's range. A -272% Fibo, a popular measurement used for targets, is located at 4.143% and the -0.61.8% Fibo is at 4.30% A full 100% expansion of the range gives us a measured move to almost 4.5% all of which bring us into the 2007/08 Financial Crisis levels.
DXY daily chart
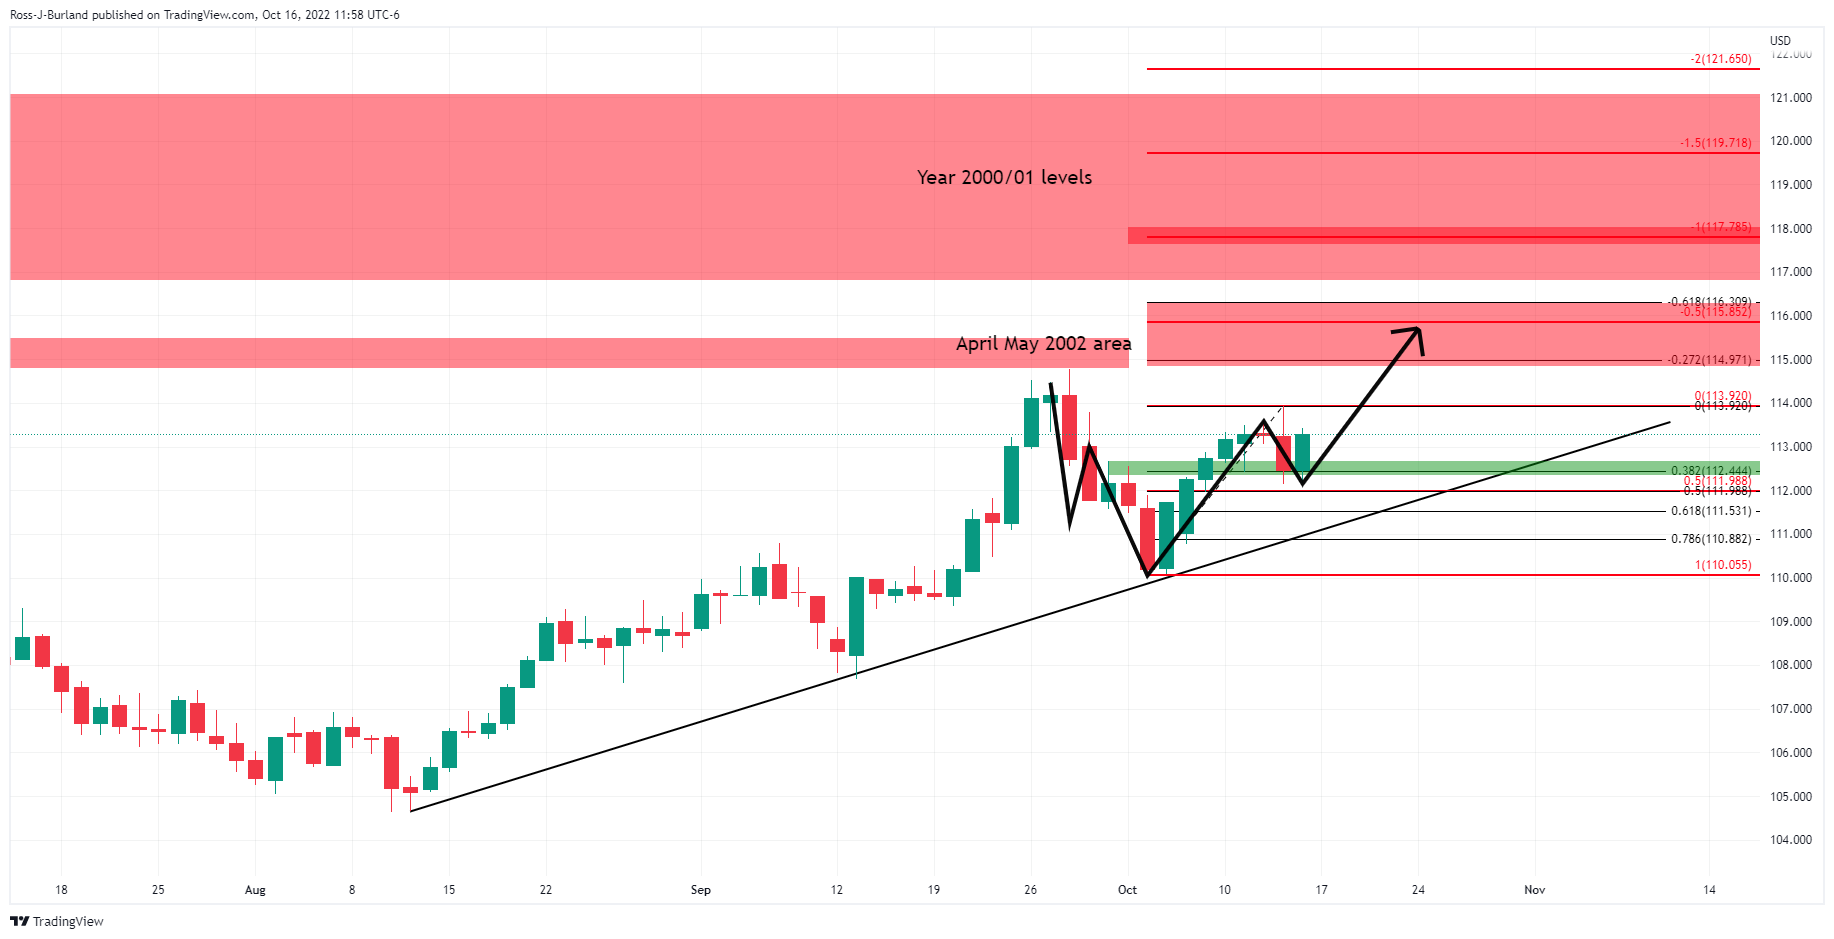
The US dollar would be expected to take the same flight path as yields and should the bulls commit into the April/May 2002 areas, then this will be expected to weigh on the yellow metal for the foreseeable future.
St. Louis Federal Reserve President James Bullard said on Saturday that it is ''way too early'' to discuss the end of QT and noted that the rapid interest rate increases have contributed to the strength of the dollar against other currencies. He said that this might only ease once the US central bank reaches the point of pausing the rate hikes, "where the committee thinks we're putting meaningful downward pressure on inflation," so rates don't need to continue rising, he said.
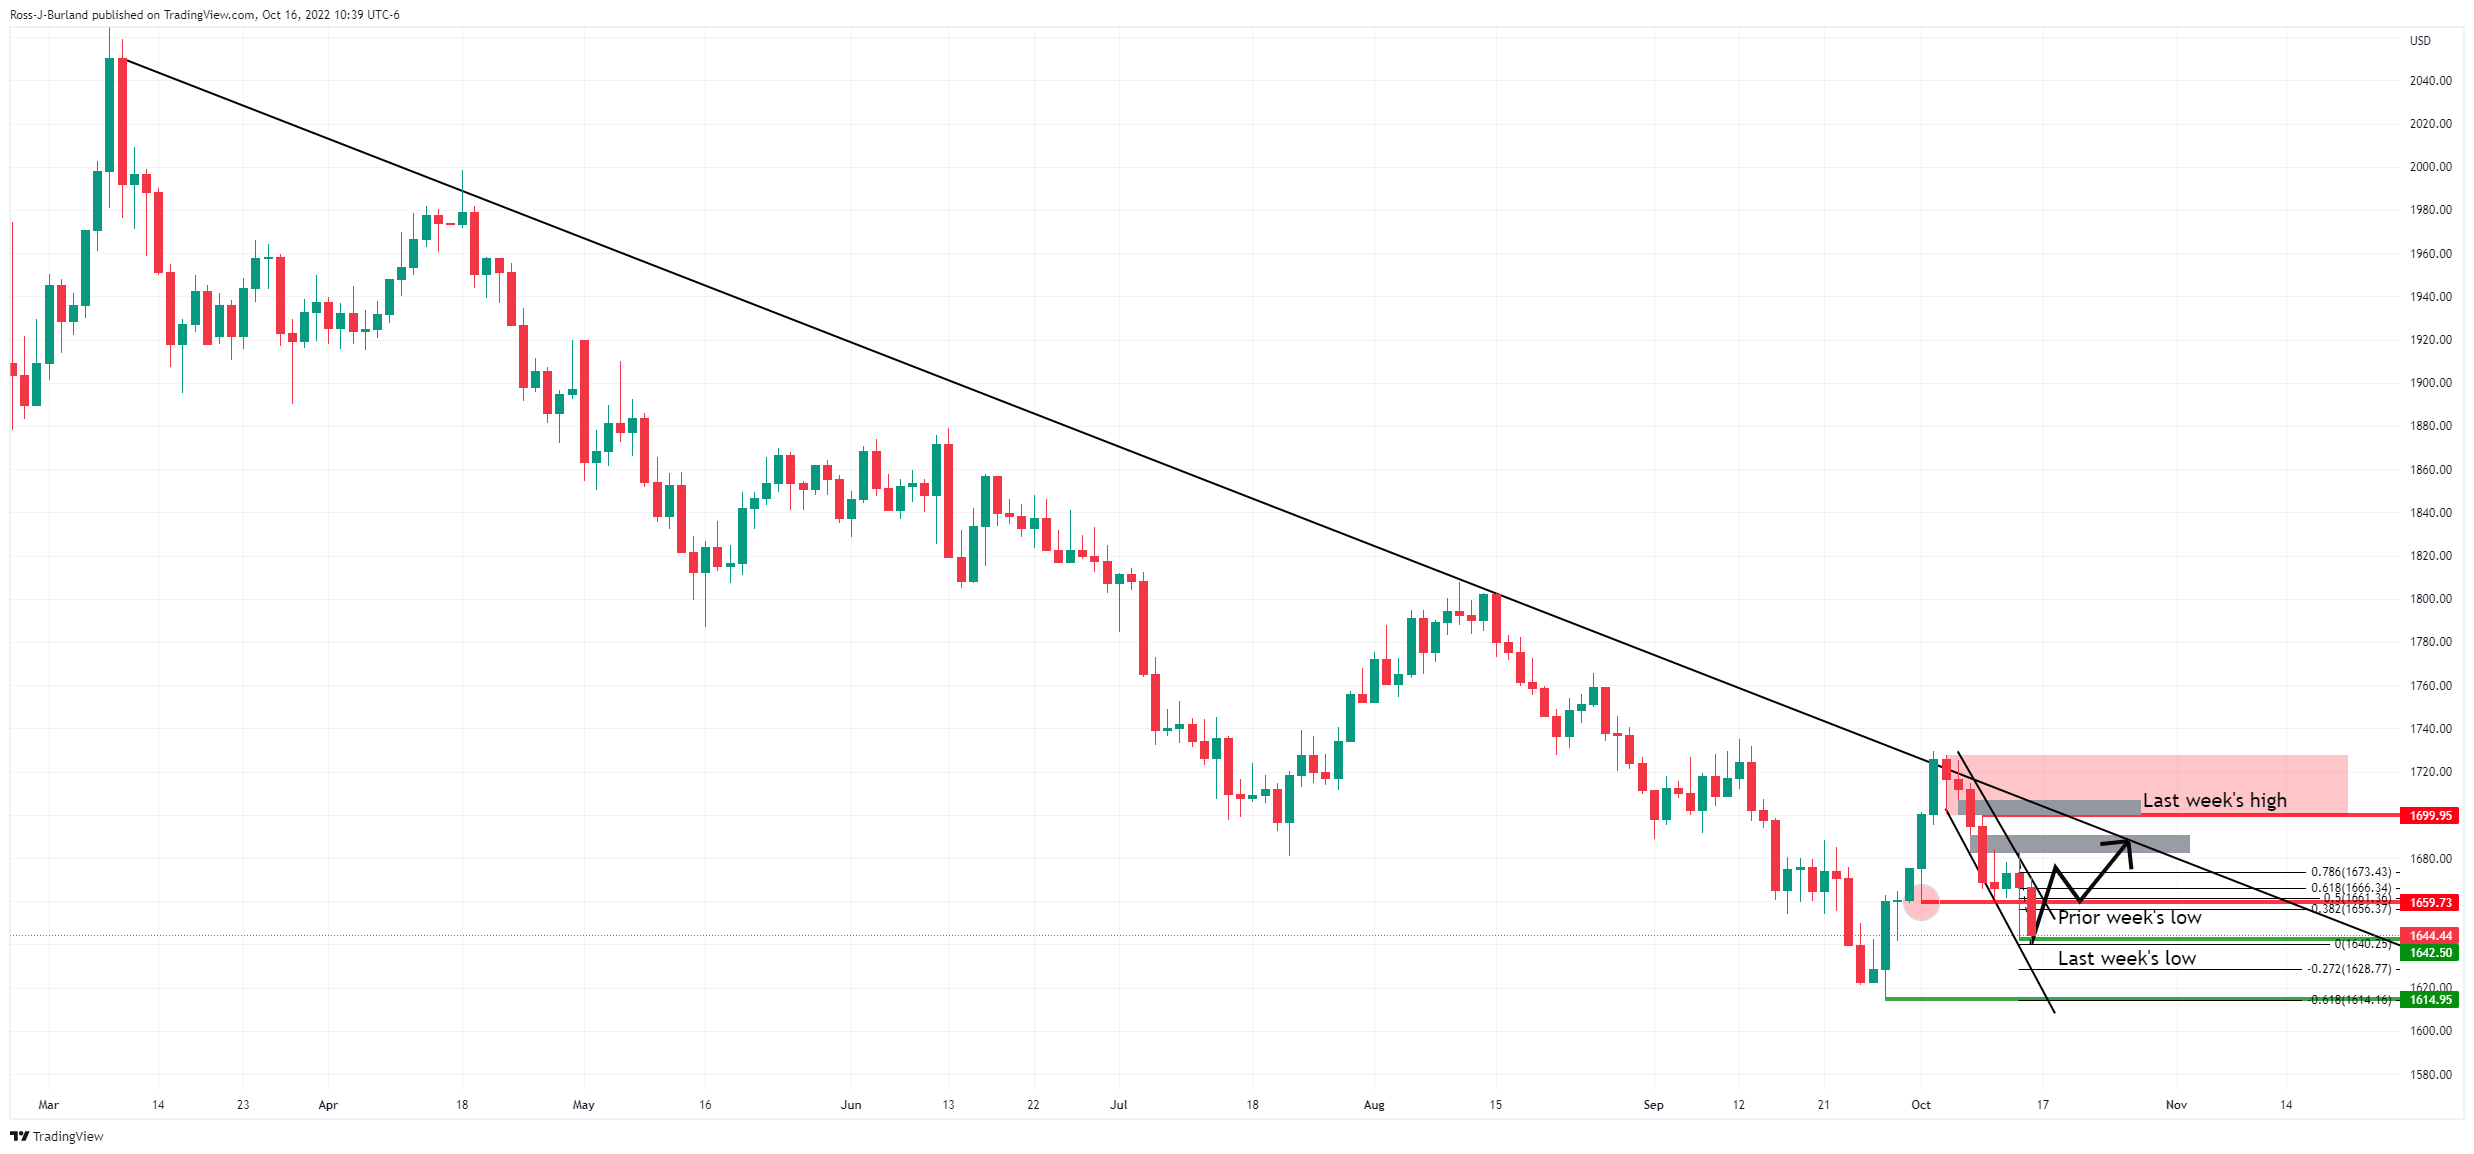
Gold weekly chart
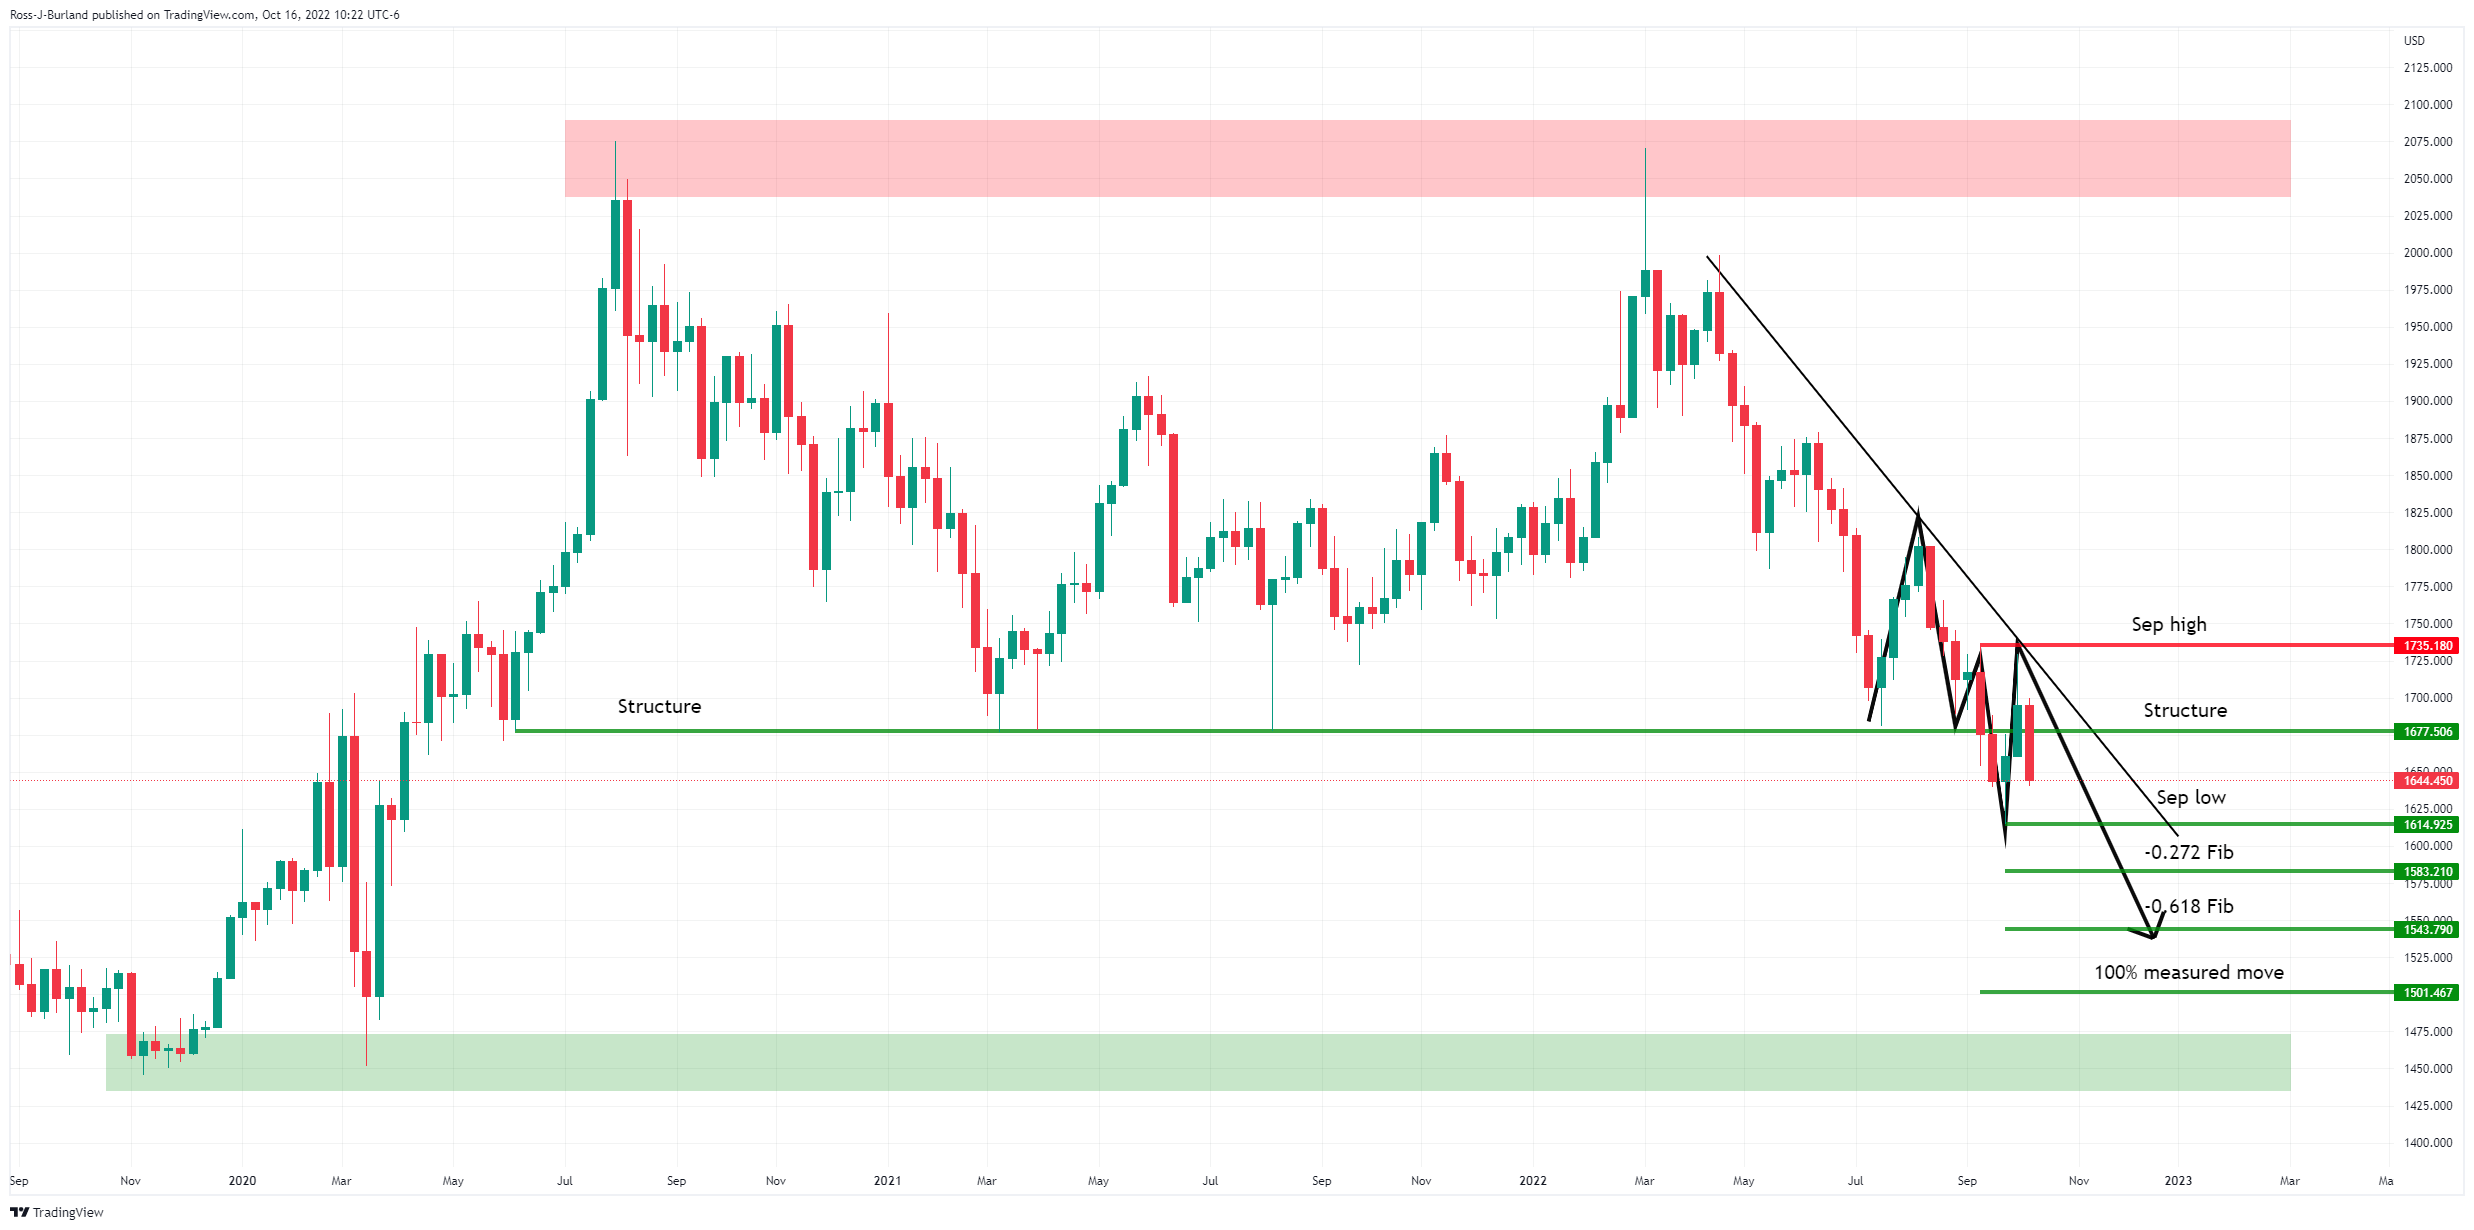
As illustrated, the price is back below the critical $,1670 structure on the weekly chart and remains on the front side of the bearish dynamic resistance. While below these, the outlook remains technically skewed to the downside. A break of September's low of $1615 opens the risk of a 100% measured move of the most recent bullish correction to the M-formation's neckline. This puts $1,500 on the radar and for a test to the 2020 demand area below it to $1,450.
Gold daily charts
The price remains on the front side of the trendline resistance but could easily break out of the microchannel for the restest of last week's highs and $1,700.
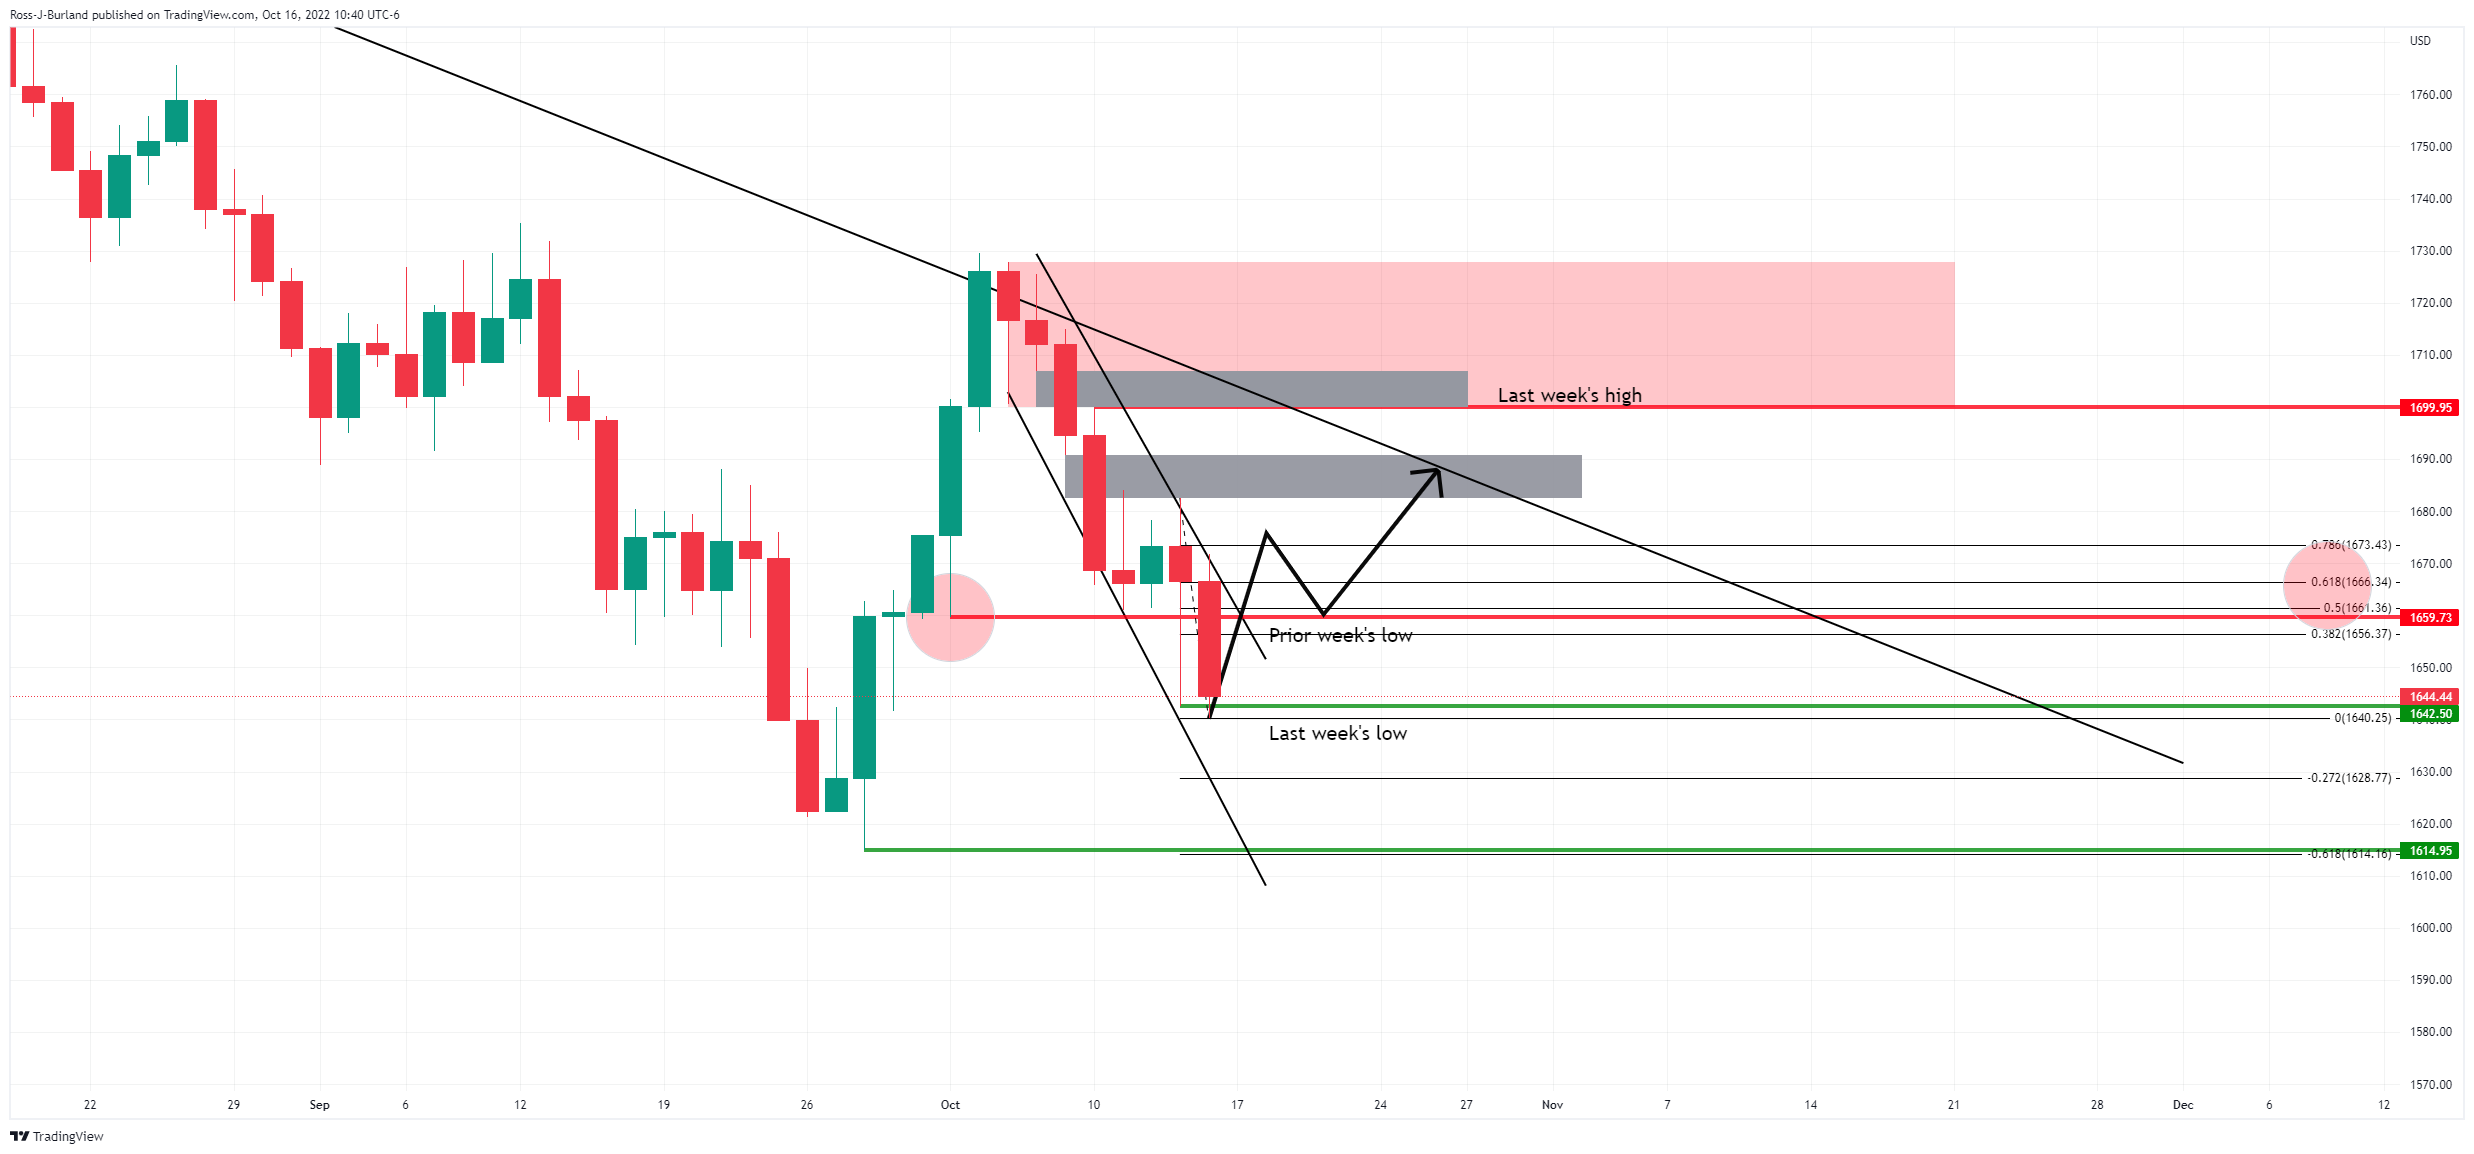
Zooming in, we can see that a break of the prior week's low will be significant in that regard and will expose the price imbalances, and greyed areas, above on the way to the trendline resistance and last week's highs.

If, on the other hand, the bears commit at the micro trendline resistance where the M-formation's neckline meets the Prior week's lows and a 38.2% Fibonacci retracement, then this could be where the price will start to head south again.
Gold H4 chart
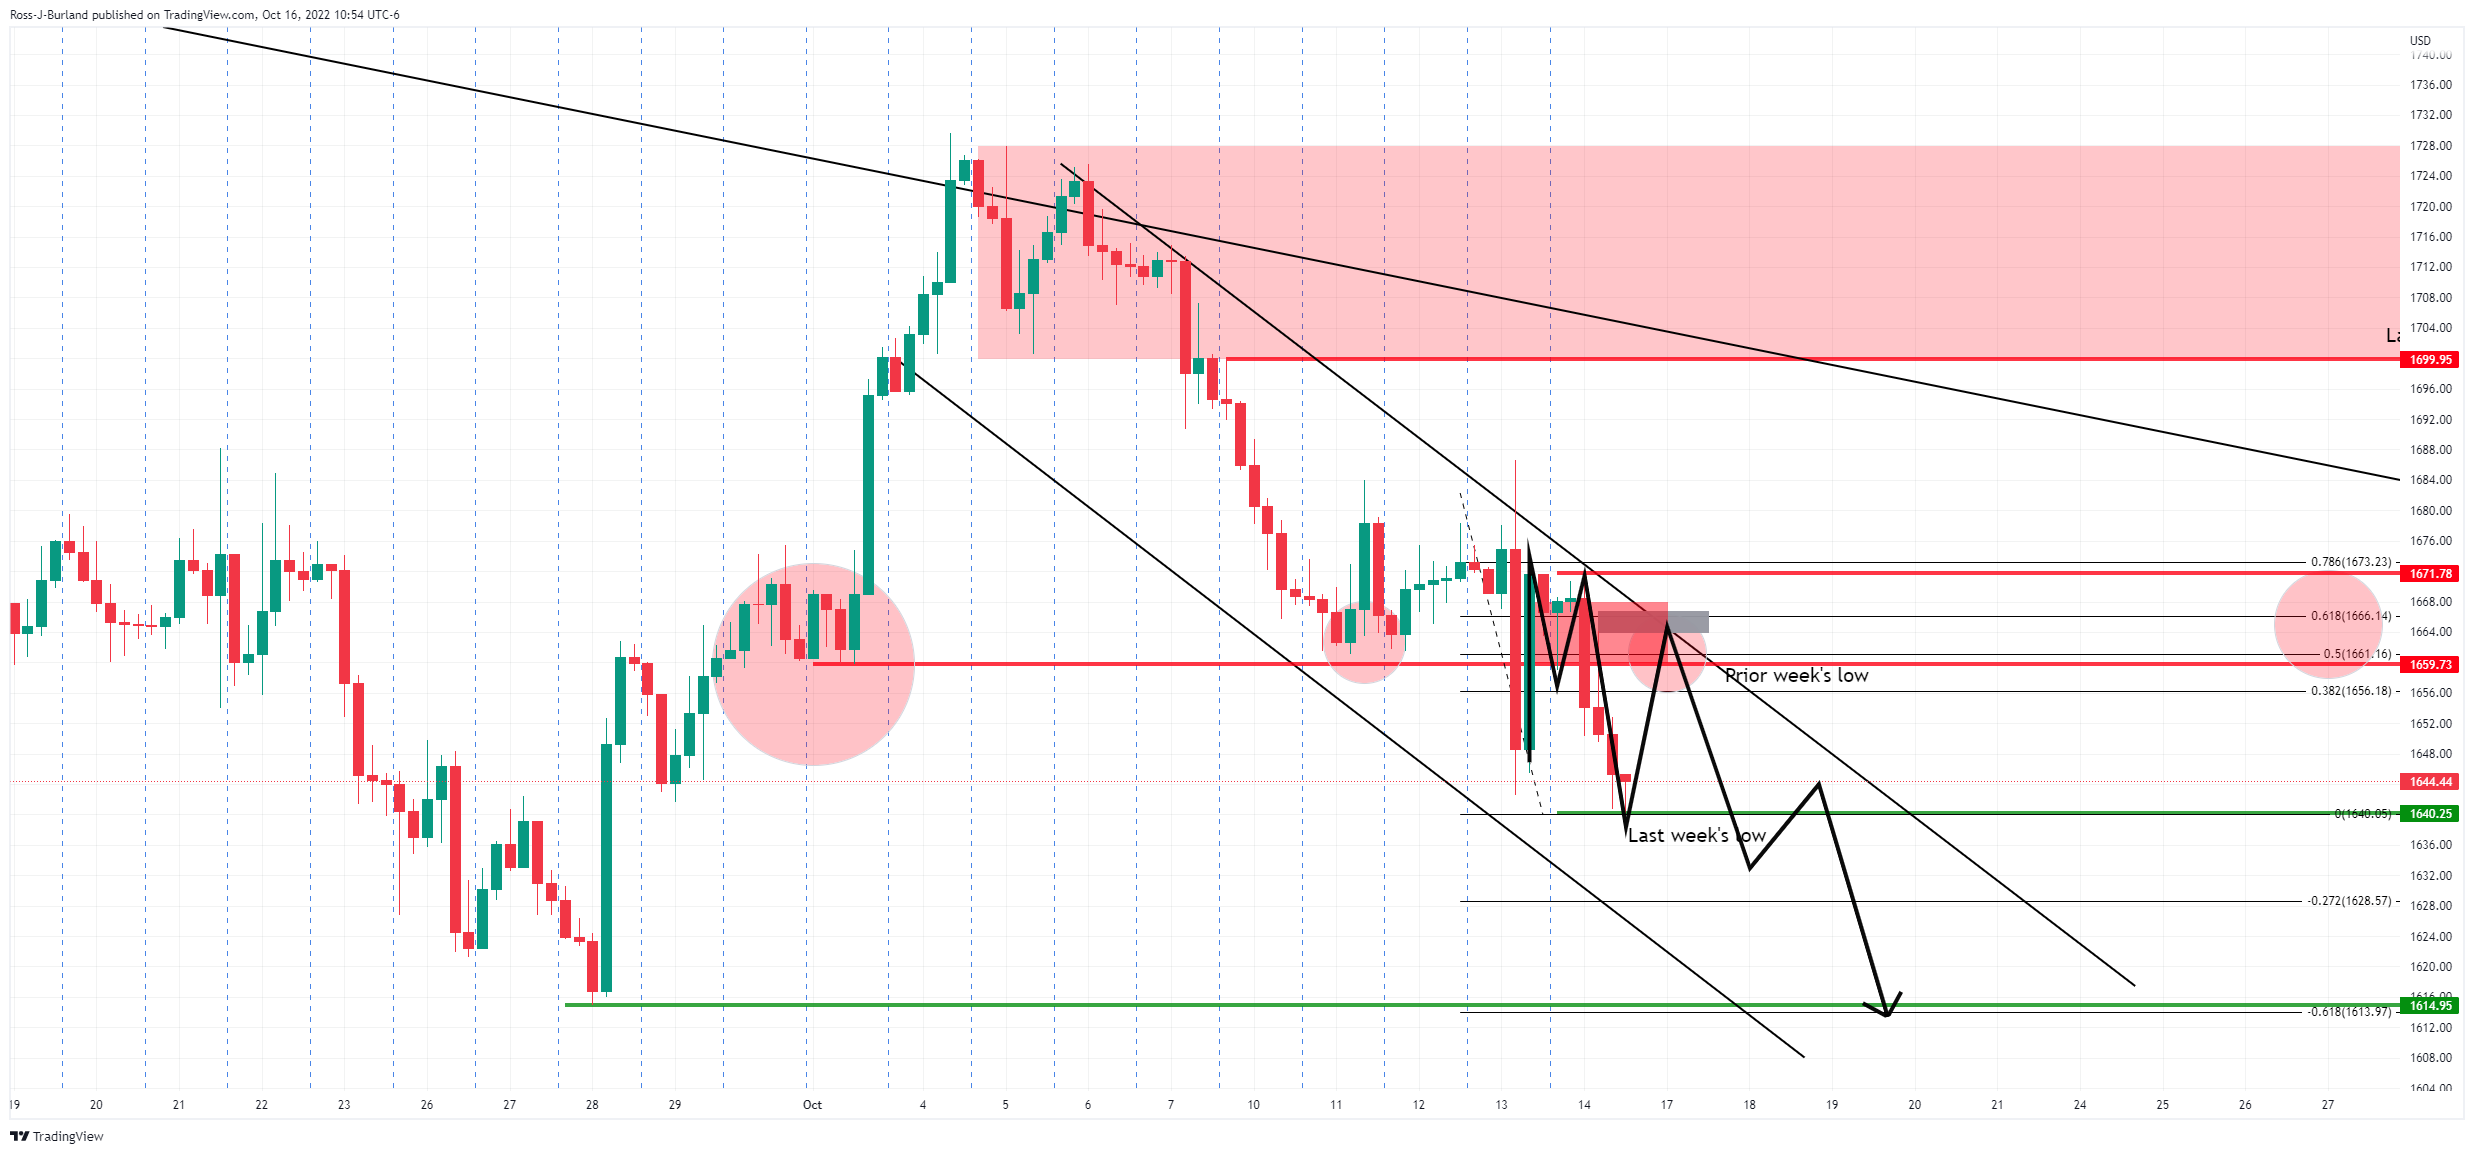
On the 4-hour time frame, we have the same scenario with an M-formation although be mindful of the price imbalance to $1,670, greyed area.
Premium
You have reached your limit of 3 free articles for this month.
Start your subscription and get access to all our original articles.
Author

Ross J Burland
FXStreet
Ross J Burland, born in England, UK, is a sportsman at heart. He played Rugby and Judo for his county, Kent and the South East of England Rugby team.


