Chart of the Week: Gold bears lurking at monthly resistance
- Gold is testing a key monthly dynamic resistance.
- Bears will be looking for a correction and bulls for a discount.

The price of gold is testing the commitments of the bears as the bulls move in on the monthly dynamic resistance within a descending channel.
This may leave a bearish bias for the week ahead and the following is a top-down analysis to illustrate the prospects of a significant correction.
Monthly chart
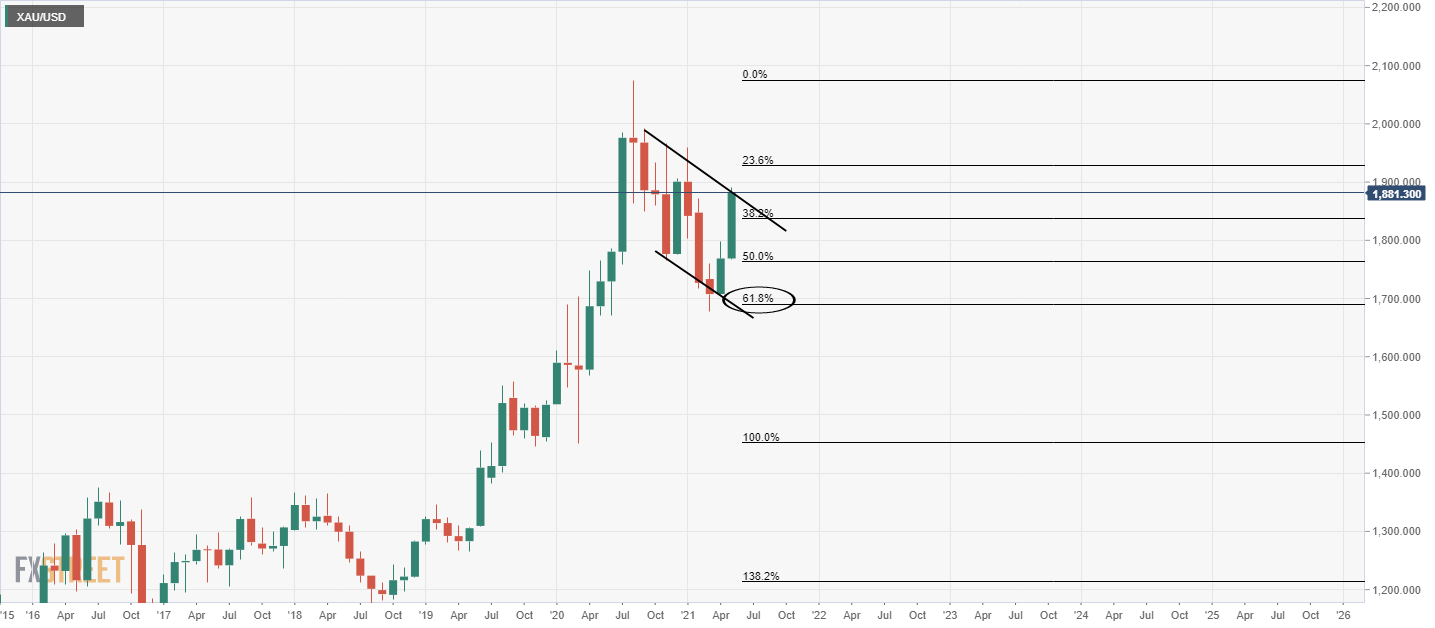
Failures at the dynamic resistance put the focus on the downside for the week ahead.
Weekly chart
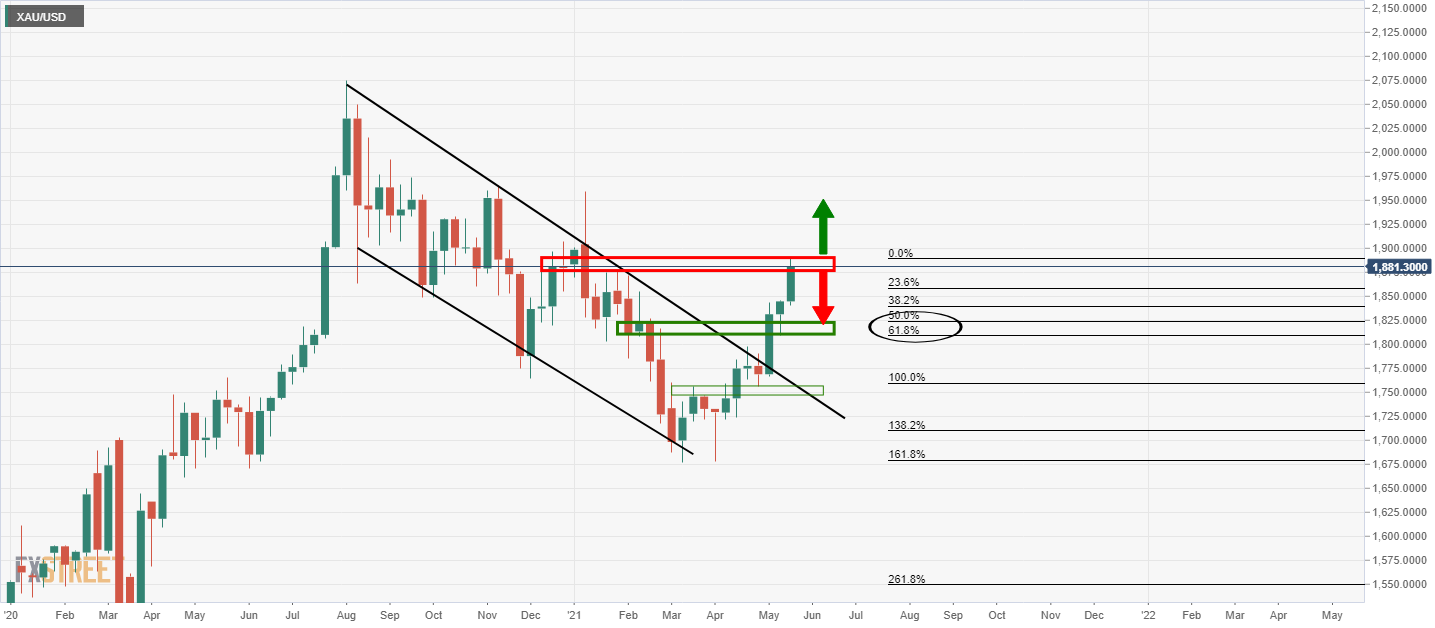
Weekly resistance is compelling, and bears will focus on the 61.8% Fibo and confluence with the prior support looking left.
Daily chart
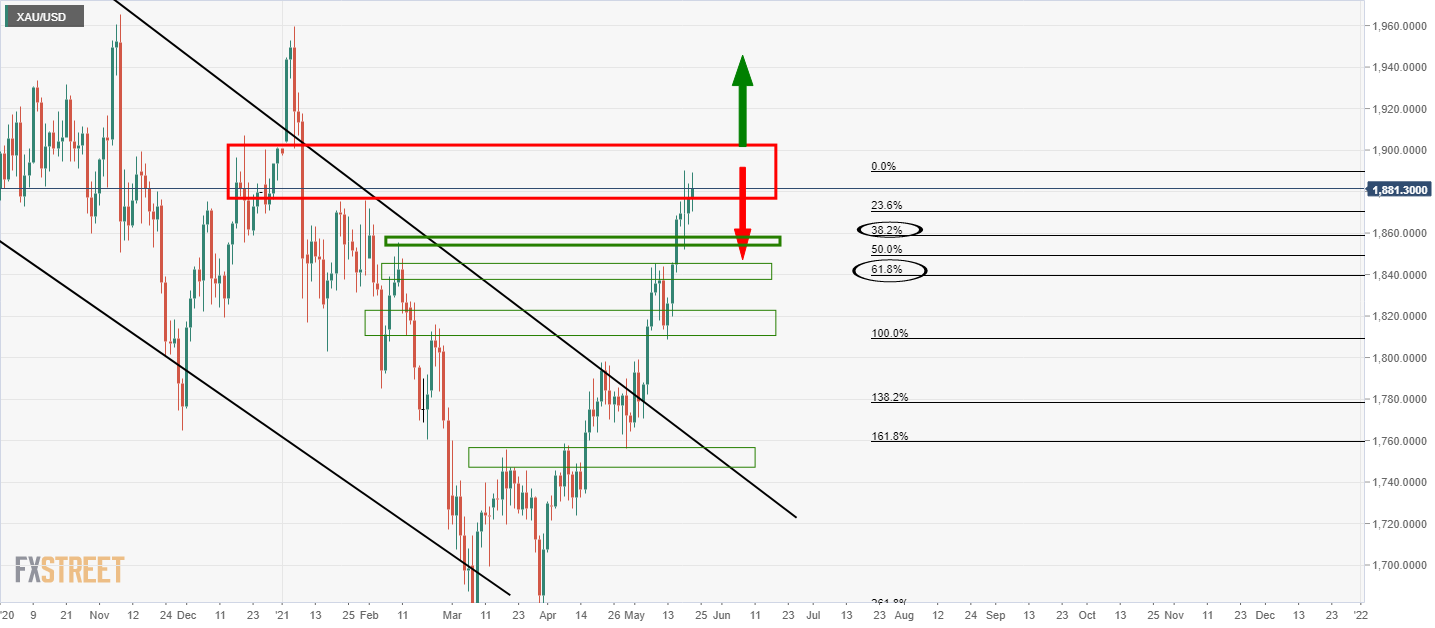
There is the scope for a deeper test of resistance, but the focus is on the downside for a significant correction to at least the 38.2% Fibo.
4-hour chart
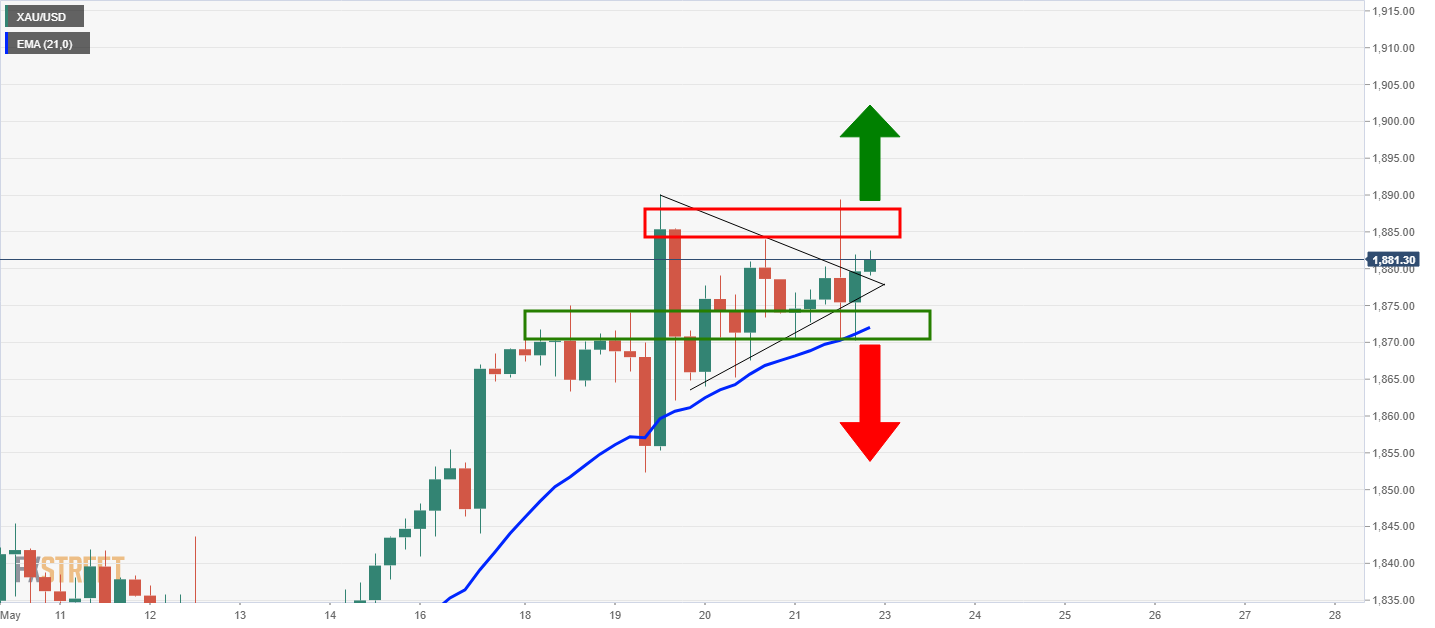
The 4-hour chart is one to monitor in the open, considering the market structure and prospects of an upside continuation if the resistance can be broken.
Premium
You have reached your limit of 3 free articles for this month.
Start your subscription and get access to all our original articles.
Author

Ross J Burland
FXStreet
Ross J Burland, born in England, UK, is a sportsman at heart. He played Rugby and Judo for his county, Kent and the South East of England Rugby team.


