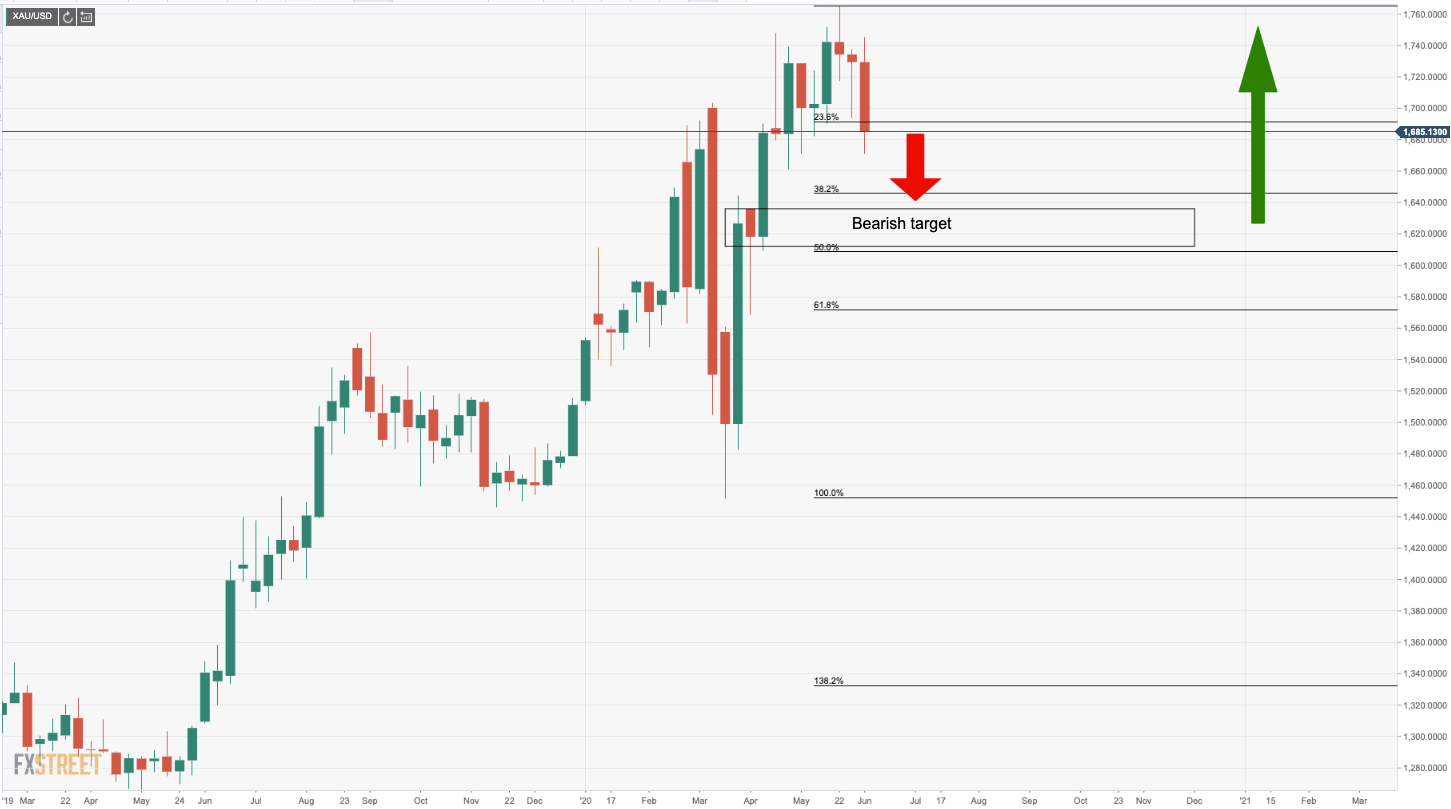
Chart of The Week: Gold bears burst into the barroom-brawl zone
- Bullish longer-term trajectory stalling as market sentiment turns positive.
- Bears taking control towards a weekly 1620 downside target.
- Barroom-brawl could make for a choppy continuation to the downside.

The price of gold has continued within the bearish trajectory highlighted in last week's analysis here: Gold Price Analysis: XAU/USD bearish case for the contrarians out there.
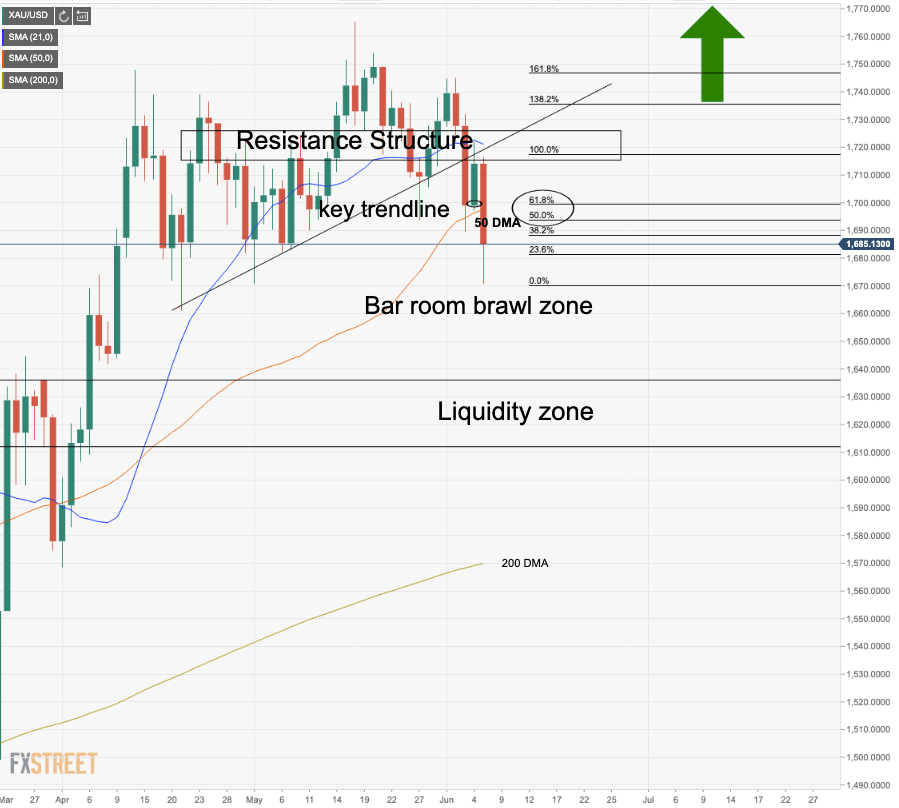
With the price now in a confirmed bearish trend, according to MACD, bullish corrections would be expected to be short-lived while respecting the resistance structure around 1700.
Further extensions are expected towards the next major support level and higher volume-profile nodes in the 1620/40s.
Weekly Chart: Bearish near-term, bullish longer-term
Daily Chart: Bears break below prior support, enter the barroom brawl

The barroom-brawl zones are otherwise known as consolidation, often as a consequence when key levels of support and resistance are broken and around key levels. Traders can be caught out here and can make the mistake of getting trapped or involved in a messy chop of prices moving up and down in non-predictable price action.
Ideally, bears will have their stops above the support and resistance structure, targeting the 1620s.
Test and failure at trendline resistance confirms the bearish trend
On a pullback, at this juncture, sell-limit order at resistance with stop loss above structure would be preferable to selling at recent lows.
4HR chart shows near-term resistance
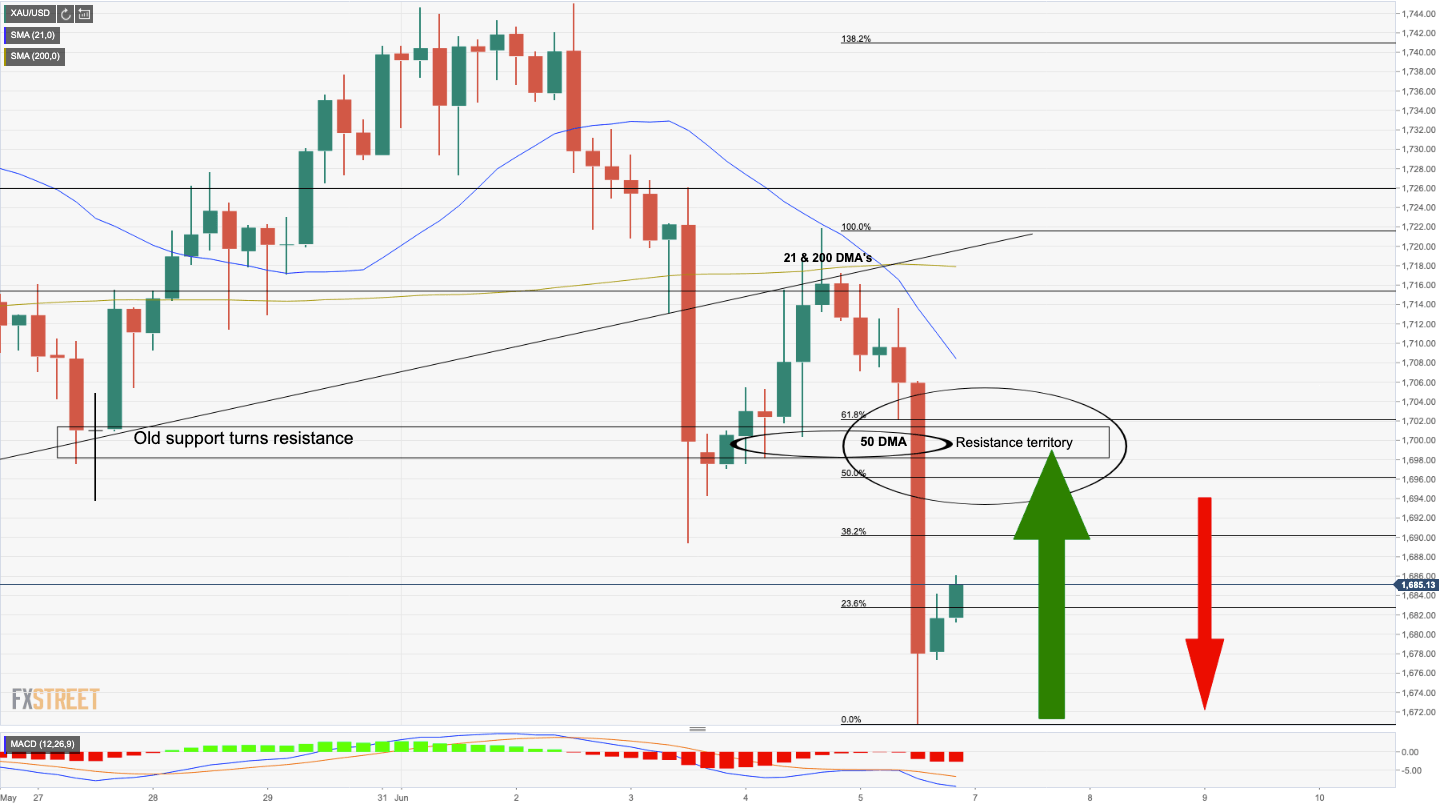
As can be seen in the 4HR time frame, MACD is bearish, price is below 21 and 200 bearish moving averages and cross-over. The 50-day moving average meets old support and the 50/61.8% Fibonacci retracements of the prior bearish impulse should offer resistance also.
Author

Ross J Burland
FXStreet
Ross J Burland, born in England, UK, is a sportsman at heart. He played Rugby and Judo for his county, Kent and the South East of England Rugby team.


