• AUD/USD on the brink of a breakout out as price tests critical resistance. 
  • There is something for everyone  on these charts, just prick your side and take your pick. 

AUD/USD is one of the most compelling set-ups in the making on the forex board. 

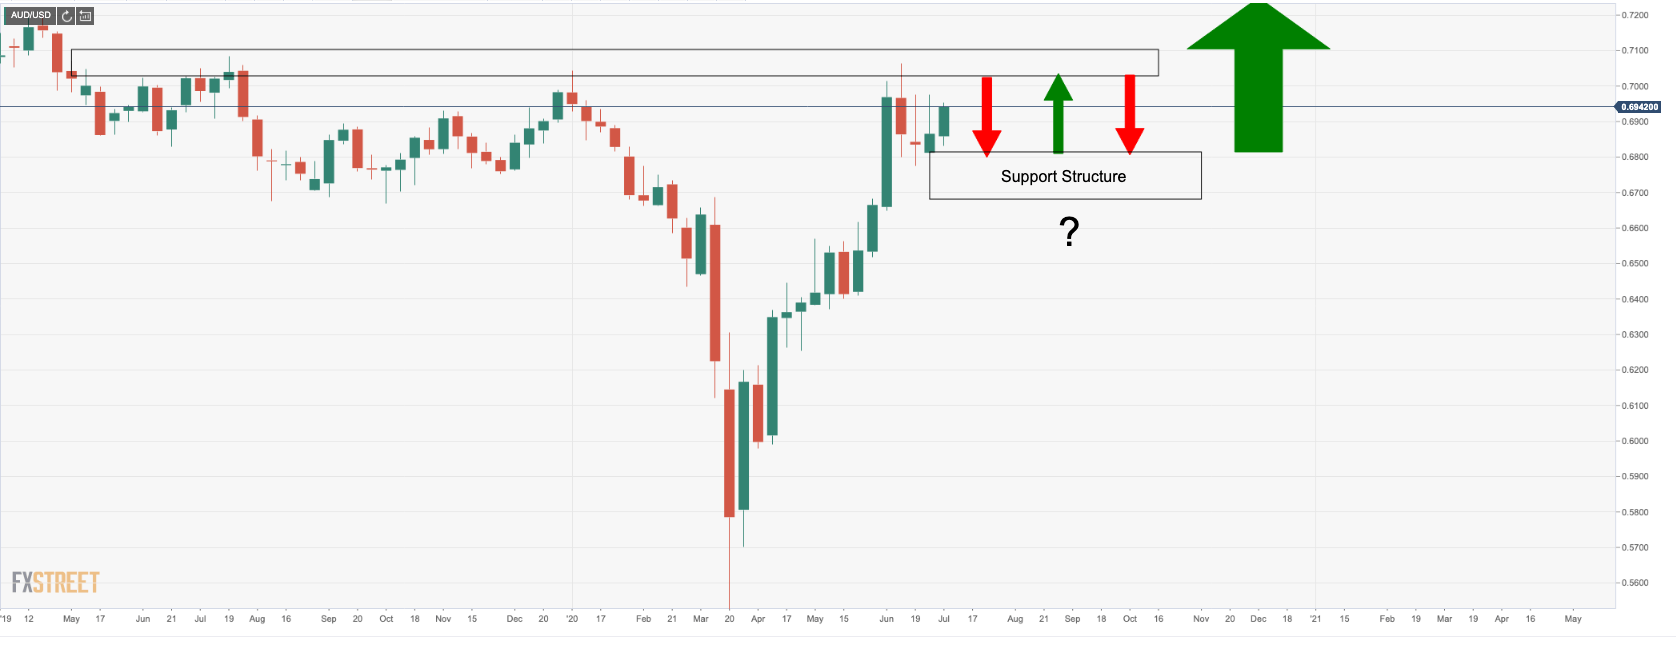
We are seeing that the price is some 28% higher since the COVID-19 recovery got underway. The price is meeting tough resistance and it may only be a matter of time before a tidal wave of supply kicks in. 

However, that is not to say that there will not be any further room to the upside, for is resistance is broken with daily support structure subsequent of the break, then the upside will remain the favoured outlook.

On repeated failures of this resistance and a switch-up in the market's positioning, the path of least resistance will be to the downside.

At this juncture, it is a waiting game for longer-term investors who don't want to be caught up in the barroom brawl.

For shorter-term traders, there are plenty of opportunities on the cards. 


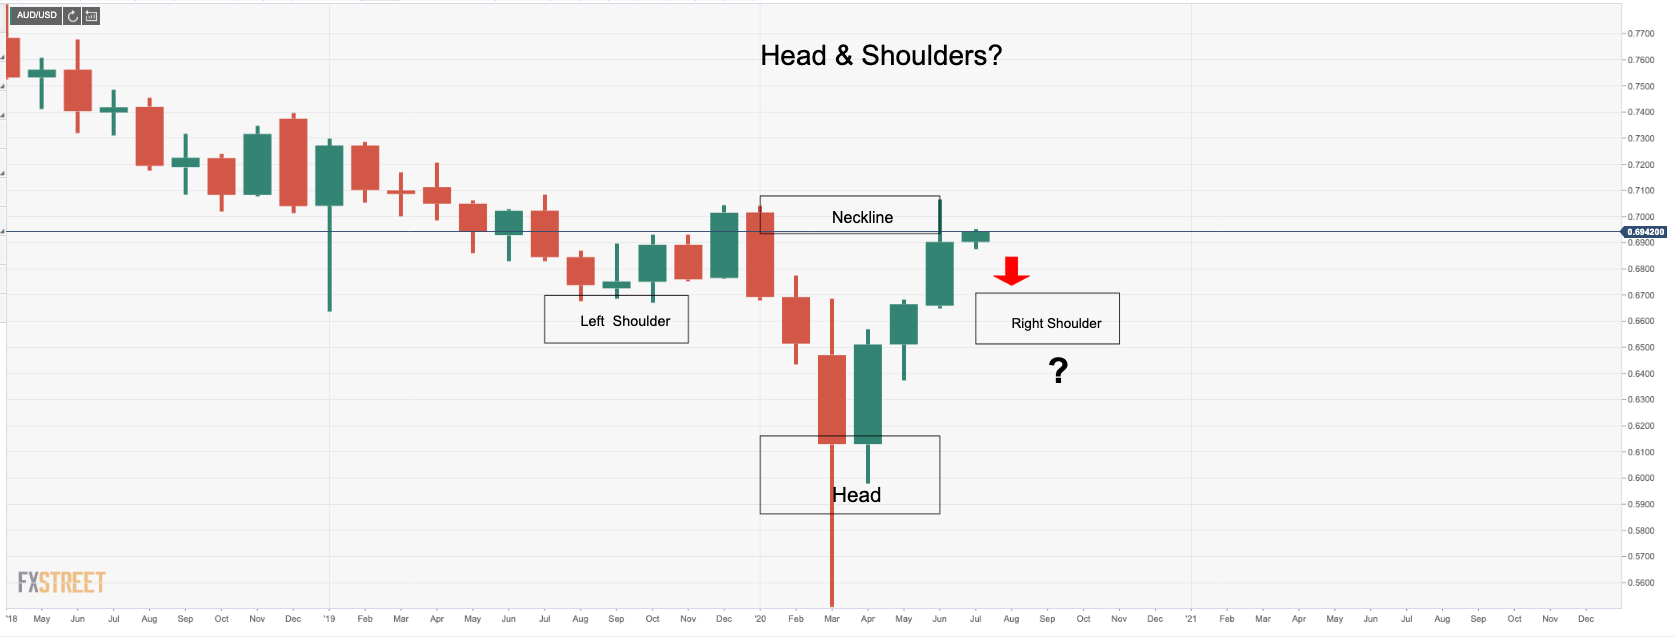
Major resistance structure has taken crucial form

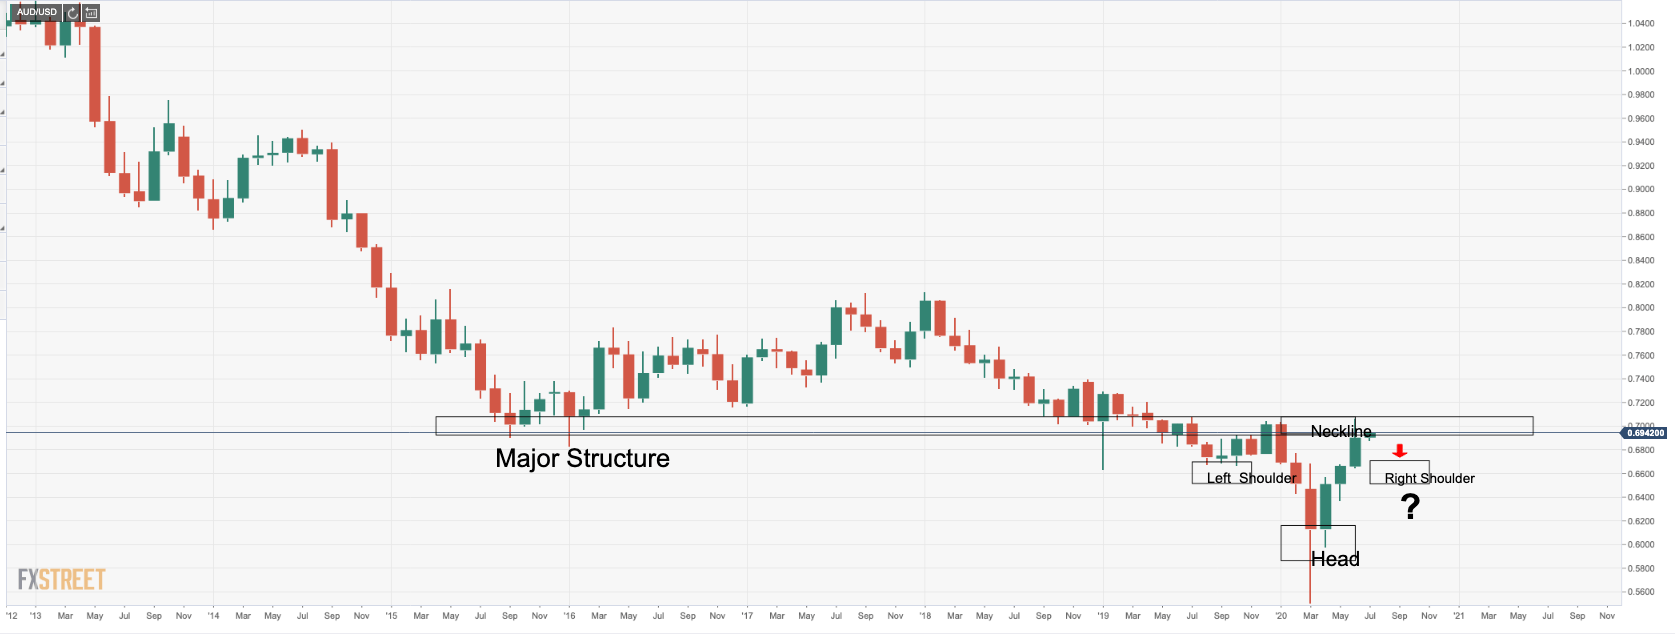
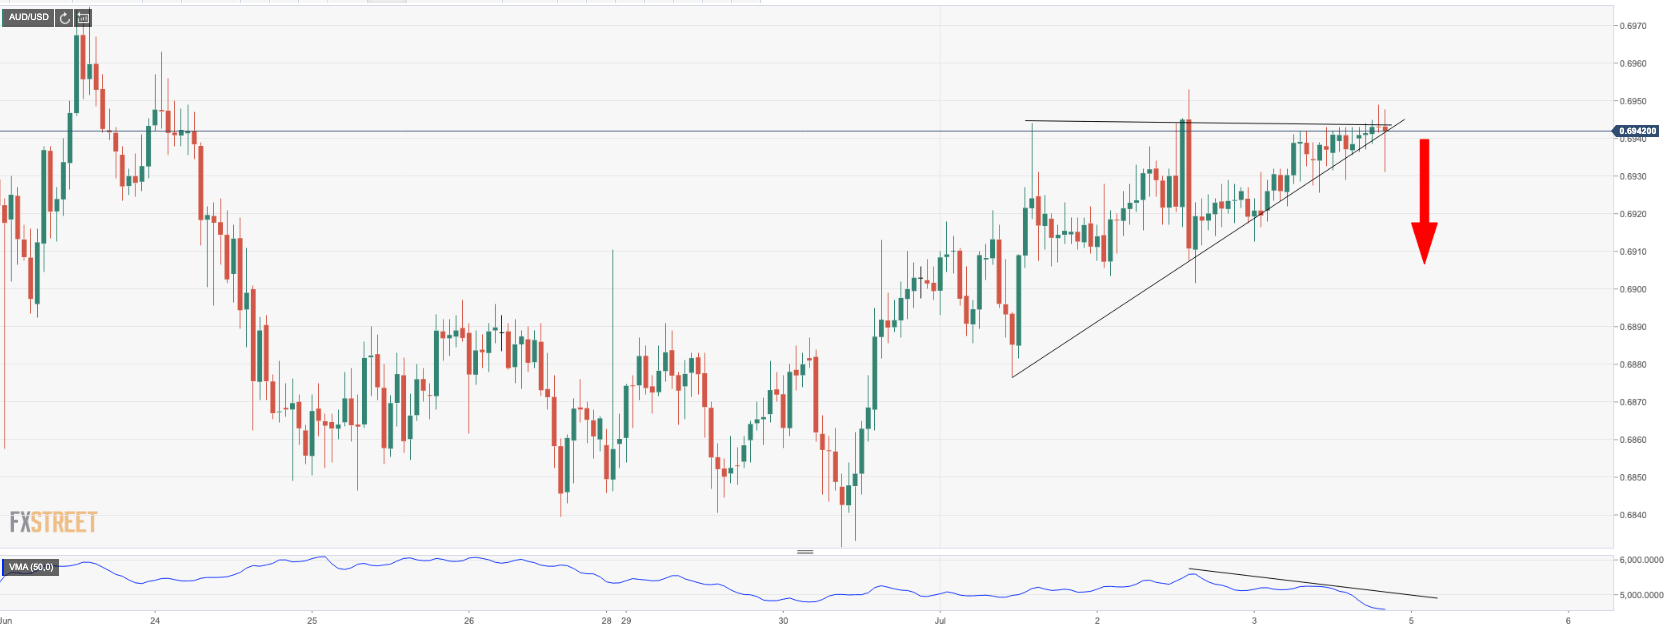
Bull/Bear sandwich, AKA, the barroom brawl

Three further attempts to test resistance so far

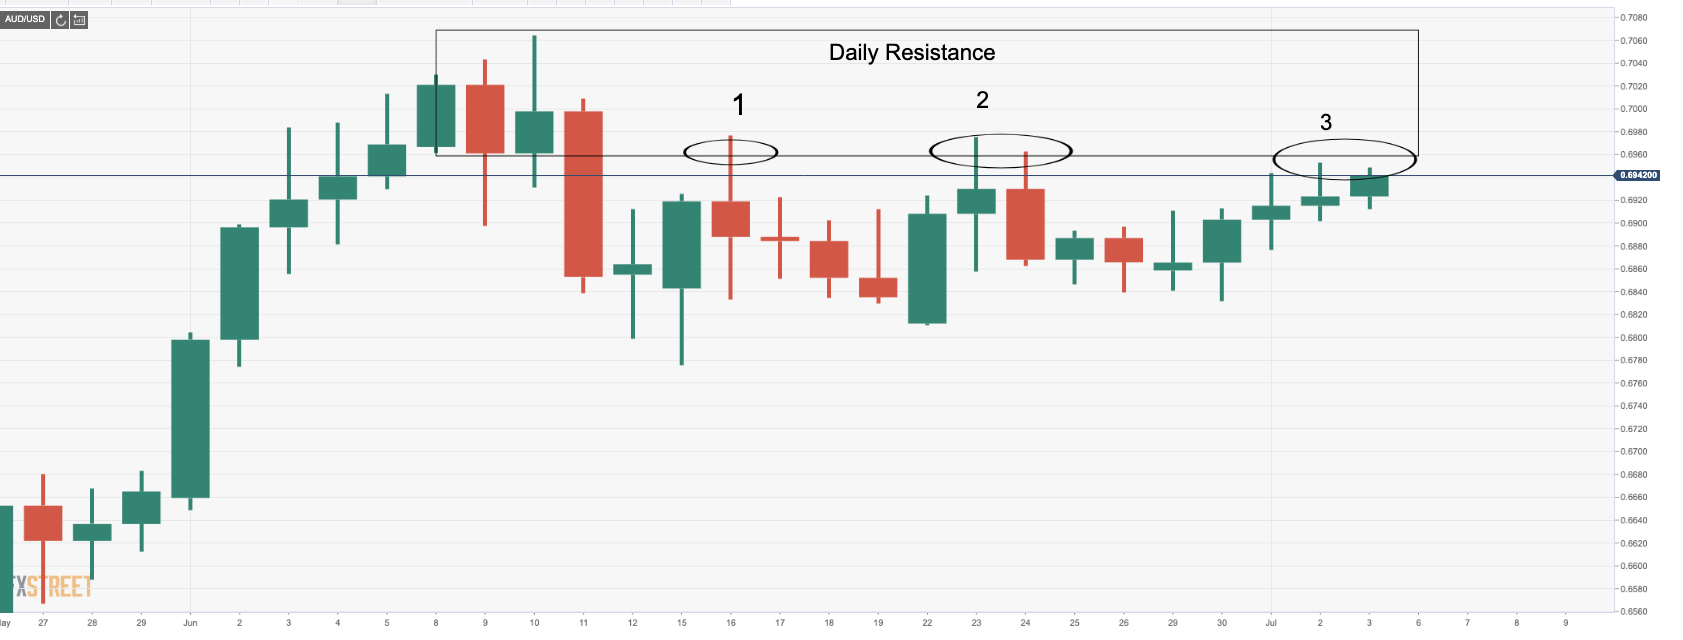
Tripple top in the making
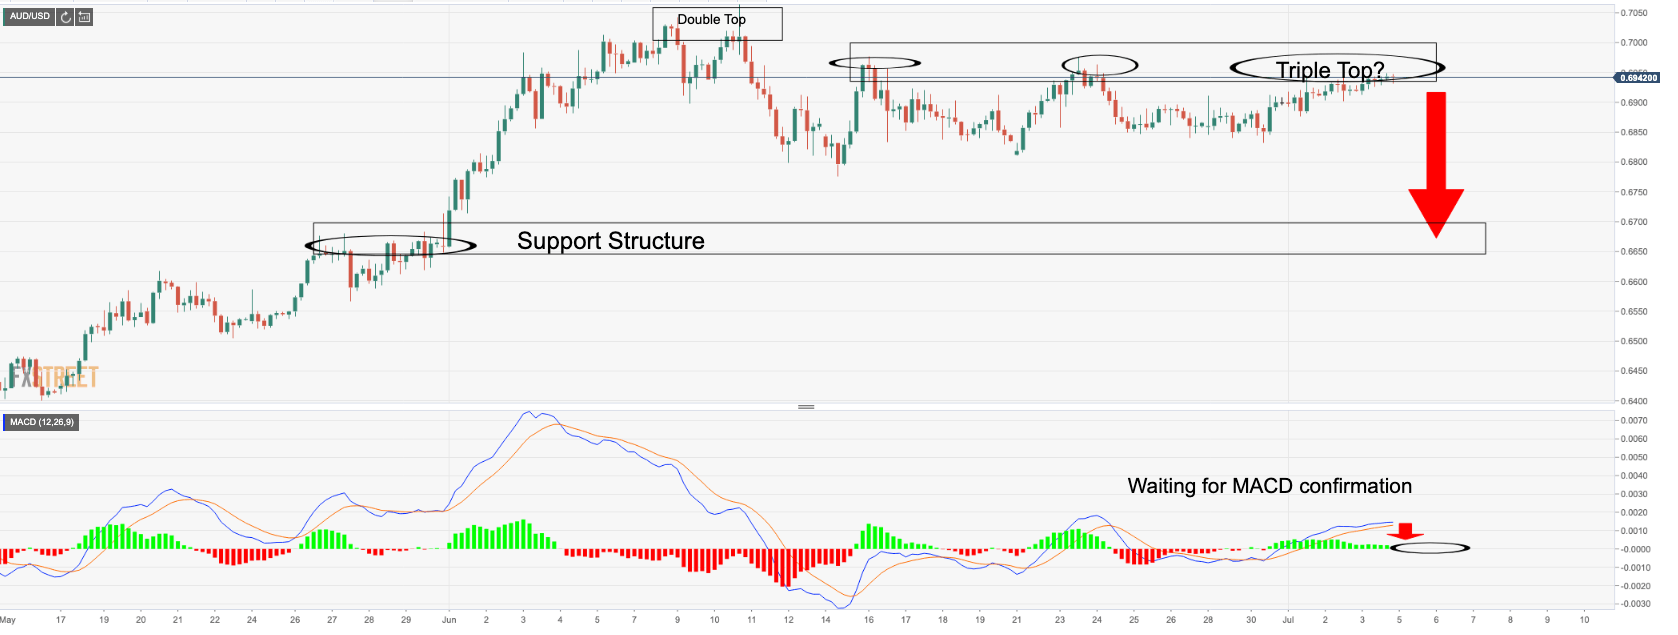
Bearish divergence 

This smoothed volume indicator is showing that there is less volume going through the market for the pair, indicating traders are on the sidelines with little interest to be holding longs at such extremes. A flurry of selling activity will likely lead to a surge of price action to the downside without much obstruction from the bulls, clearing out the stale stop losses.  

Last dance from the buyers before major sell-off?

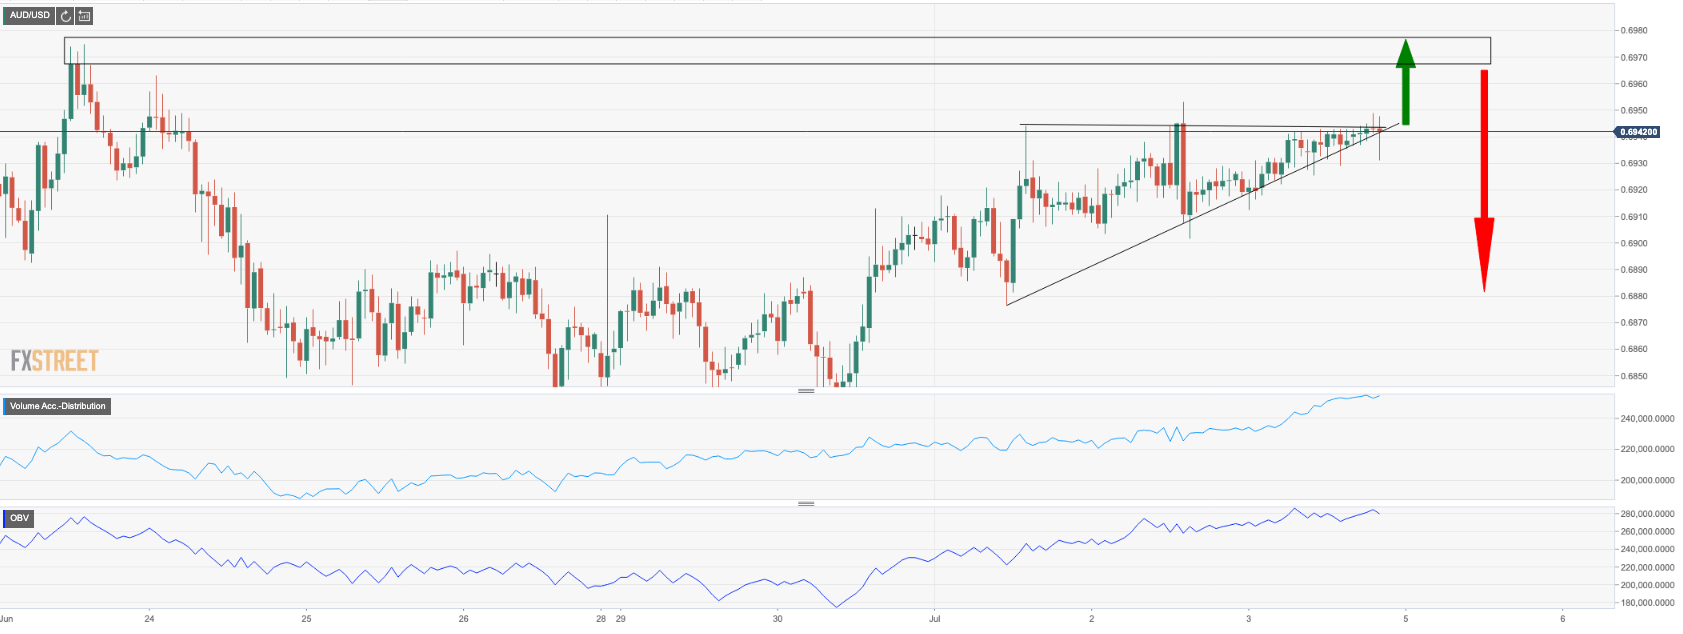
As we can see, from the On Balance Volume (OBV) and the Accumulation and Distribution indicators, as well as reading from COT data of late, we have seen a trimming of shorts in a phase of an accumulation from institutions. 

We will wait to see how things develop, but this makes the perfect storm for a bull trap on the breakout of the ascending triangle and current resistance. 

Paying particular notice to the OBV, which is based on the distinction between institutional investors and retail investors, the theory here is that as institutional investors will begin to buy into what retail investors have been selling. 

The increase in volume should drive the price upward, at which point, larger investors begin to sell, trapping the bulls and making for a major switch in trajectory in the price away from resistance in a fresh phase of distribution. 

Up, UP and away

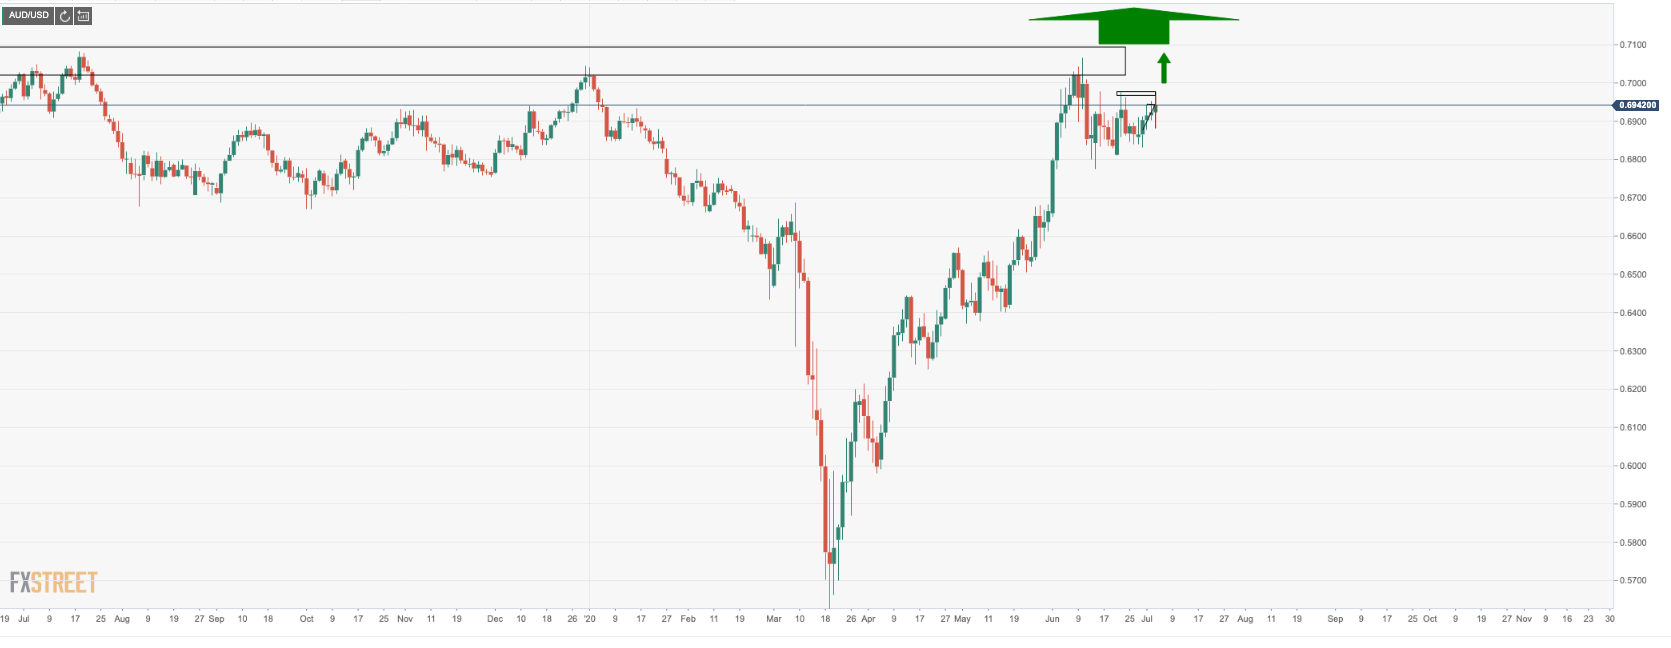
On the other hand, a break of top side structure will lead to a continuation of the Aussie's remarkable resilience for 2020 so far. 

Information on these pages contains forward-looking statements that involve risks and uncertainties. Markets and instruments profiled on this page are for informational purposes only and should not in any way come across as a recommendation to buy or sell in these assets. You should do your own thorough research before making any investment decisions. FXStreet does not in any way guarantee that this information is free from mistakes, errors, or material misstatements. It also does not guarantee that this information is of a timely nature. Investing in Open Markets involves a great deal of risk, including the loss of all or a portion of your investment, as well as emotional distress. All risks, losses and costs associated with investing, including total loss of principal, are your responsibility. The views and opinions expressed in this article are those of the authors and do not necessarily reflect the official policy or position of FXStreet nor its advertisers. The author will not be held responsible for information that is found at the end of links posted on this page.

If not otherwise explicitly mentioned in the body of the article, at the time of writing, the author has no position in any stock mentioned in this article and no business relationship with any company mentioned. The author has not received compensation for writing this article, other than from FXStreet.

FXStreet and the author do not provide personalized recommendations. The author makes no representations as to the accuracy, completeness, or suitability of this information. FXStreet and the author will not be liable for any errors, omissions or any losses, injuries or damages arising from this information and its display or use. Errors and omissions excepted.

The author and FXStreet are not registered investment advisors and nothing in this article is intended to be investment advice.

Recommended Content


Recommended Content

Editors’ Picks

EUR/USD hovers around 1.0700, eyes on US first-quarter GDP data

EUR/USD hovers around 1.0700, eyes on US first-quarter GDP data

EUR/USD hovers around the 1.0700 psychological level on Thursday during the early Thursday. The modest uptick of the major pair is supported by the softer US Dollar. Later in the day, Germany’s GfK Consumer Confidence Survey for April will be released. 

EUR/USD News

USD/JPY finds its highest bids since 1990, near 155.50

USD/JPY finds its highest bids since 1990, near 155.50

USD/JPY keeps breaking into its highest chart territory since June of 1990 early Thursday, testing 155.50 for the first time in 34 years as the Japanese Yen remains vulnerable, despite looming Japanese intervention risks. Focus shifts to Thursday's US GDP report and the BoJ decision on Friday. 

USD/JPY News

Gold price lacks firm intraday direction, holds steady above $2,300 ahead of US data

Gold price lacks firm intraday direction, holds steady above $2,300 ahead of US data

Gold price remains confined in a narrow band for the second straight day on Thursday. Reduced Fed rate cut bets and a positive risk tone cap the upside for the commodity. Traders now await key US macro data before positioning for the near-term trajectory.

Gold News

Injective price weakness persists despite over 5.9 million INJ tokens burned

Injective price weakness persists despite over 5.9 million INJ tokens burned

Injective price is trading with a bearish bias, stuck in the lower section of the market range. The bearish outlook abounds despite the network's deflationary efforts to pump the price. Coupled with broader market gloom, INJ token’s doomed days may not be over yet.

Read more

Meta Platforms Earnings: META sinks 10% on lower Q2 revenue guidance Premium

Meta Platforms Earnings: META sinks 10% on lower Q2 revenue guidance

This must be "opposites" week. While Doppelganger Tesla rode horrible misses on Tuesday to a double-digit rally, Meta Platforms produced impressive beats above Wall Street consensus after the close on Wednesday, only to watch the share price collapse by nearly 10%.

Read more

Majors

Cryptocurrencies

Signatures