|

Chart of the Week: AUD/USD bears seeking a double top for H&S downside targets

  • AUD/USD can be perceived to have entered a phase of accumulation on the long-term time frames.
  • A reverse H&S is in the making for a reversal pattern.
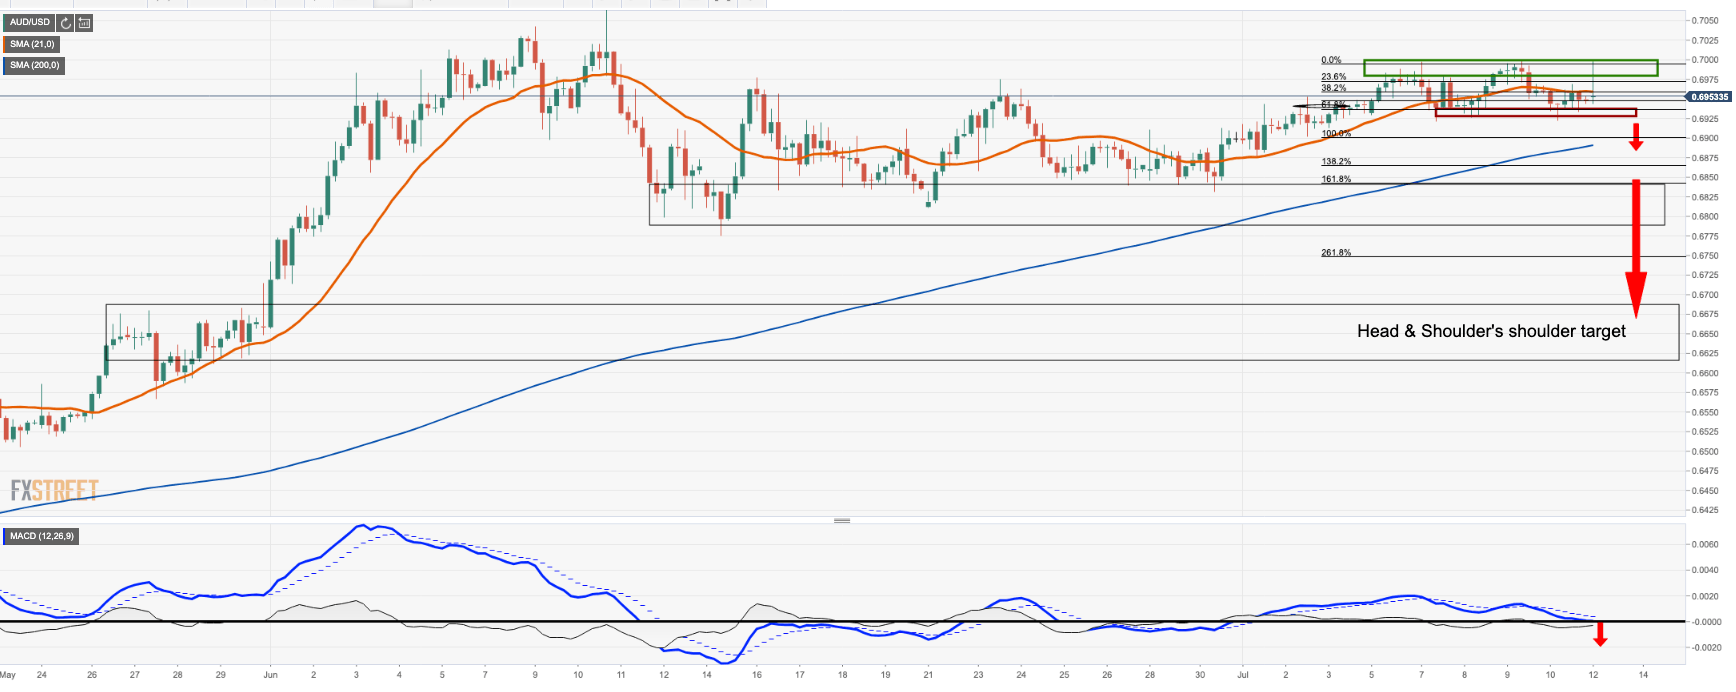
  • First, the bears will be in charge and seeking out a right-hand shoulder target.

AUD/USD is in a critical area as bulls and bears battle it out in the barroom brawl between breakout resistance and support.

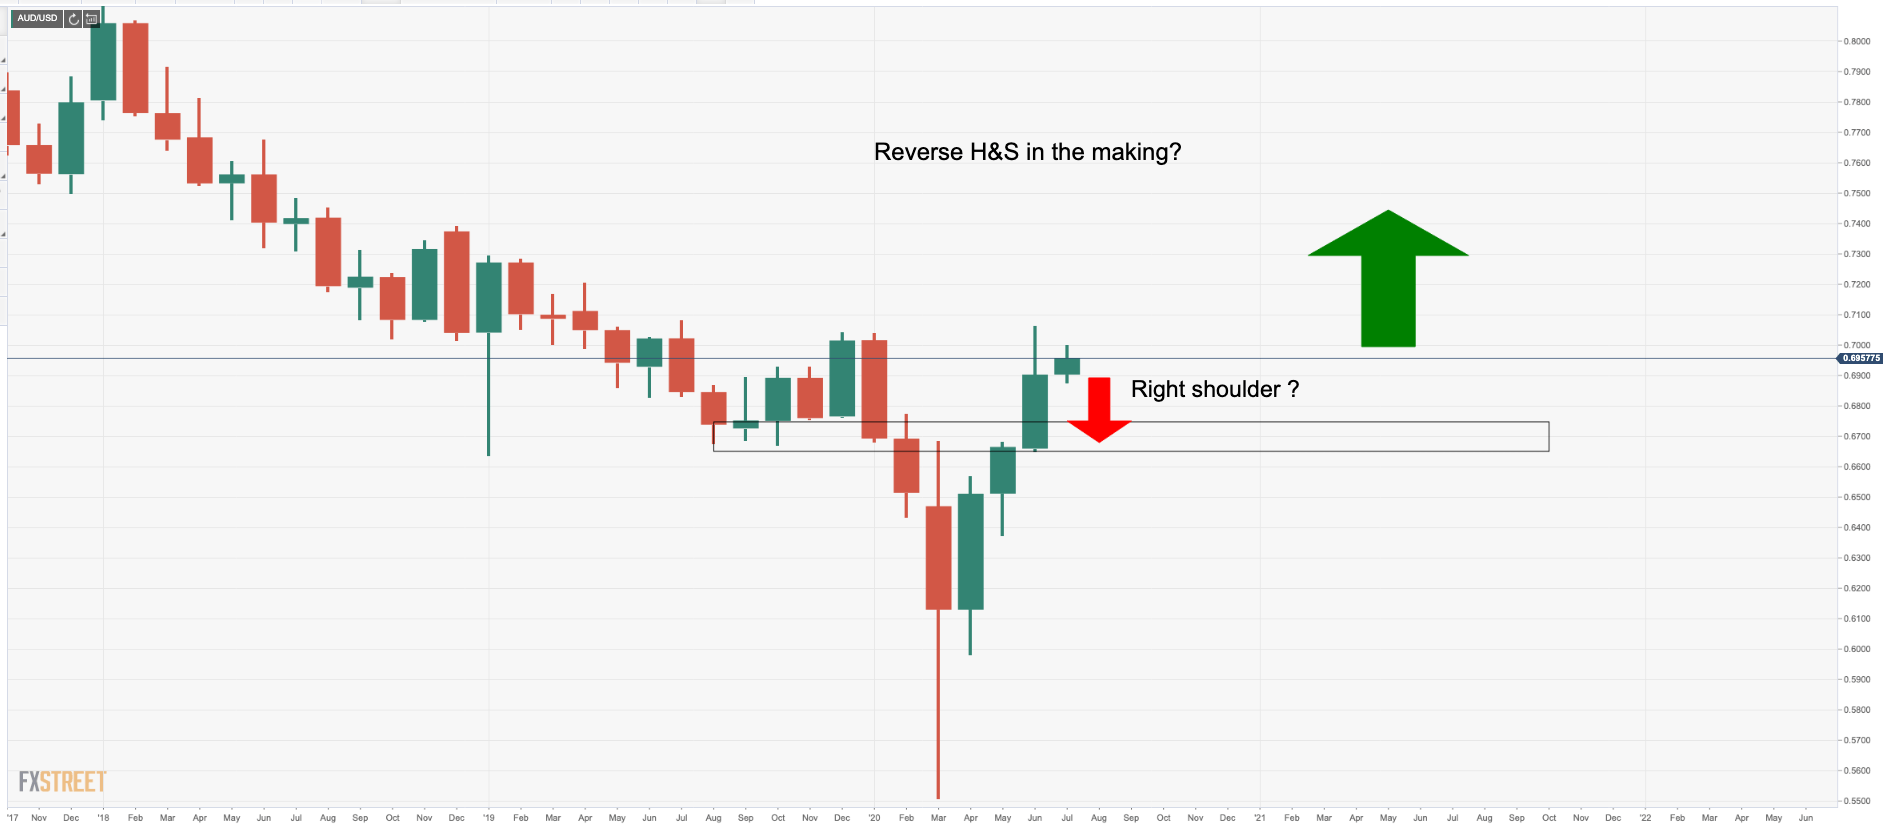
On the monthly chart, the outlook is clear, with a reverse head and shoulders in the making. 

However, should the price fail to move lower at this juncture, then the bulls will keep control and the bearish play will be invalidated. 

Instead, the weekly impulse, correction impulse will be in play as follows (Bullish scenario):
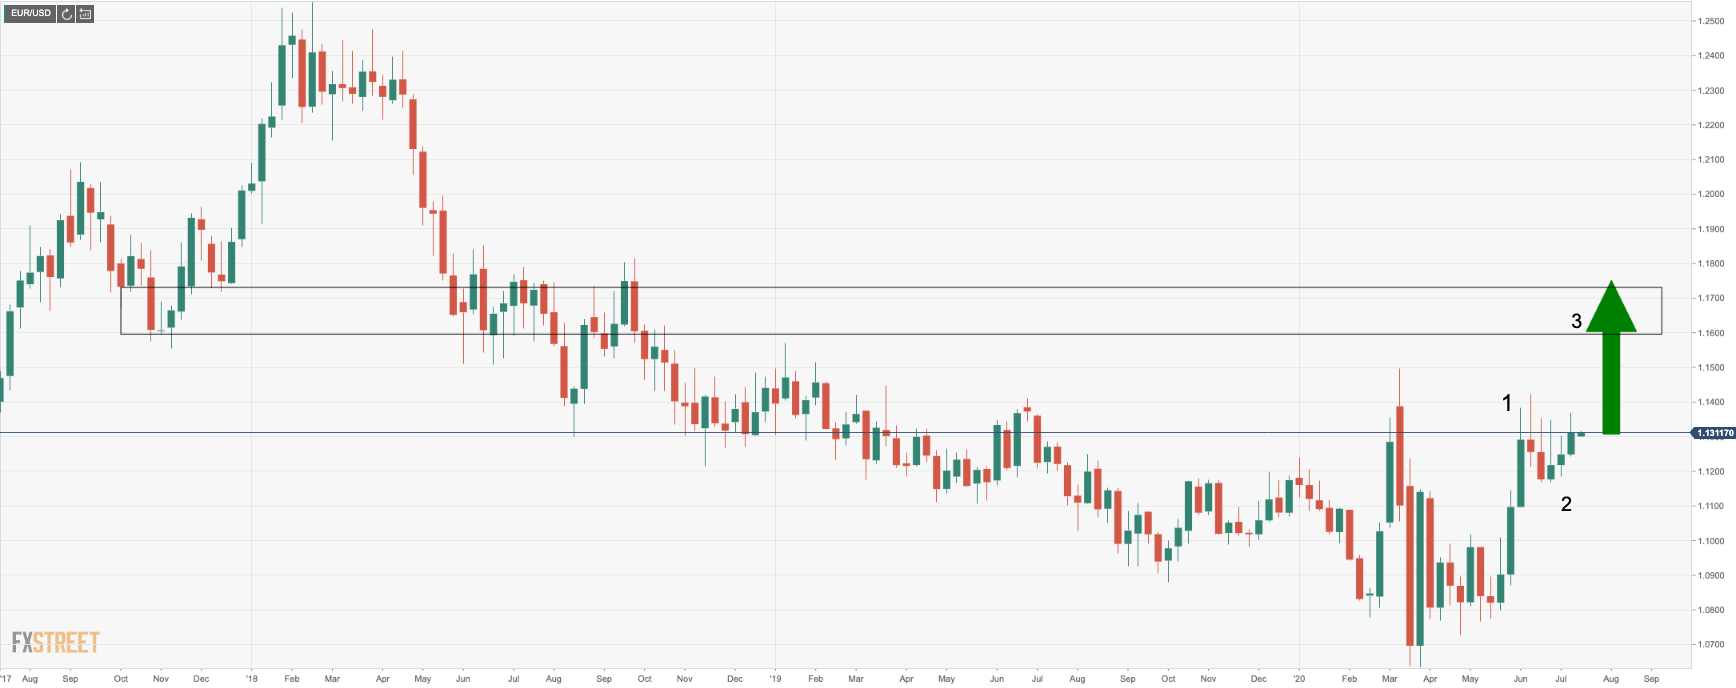
First bearish, then the bullish scenario

As we move down to the weekly, daily and 4HR, we can zoom in on the critical areas in a top-down analysis as follows (presuming the right-hand shoulder being completed):

Monthly outlook, inverse Head & Shoulders
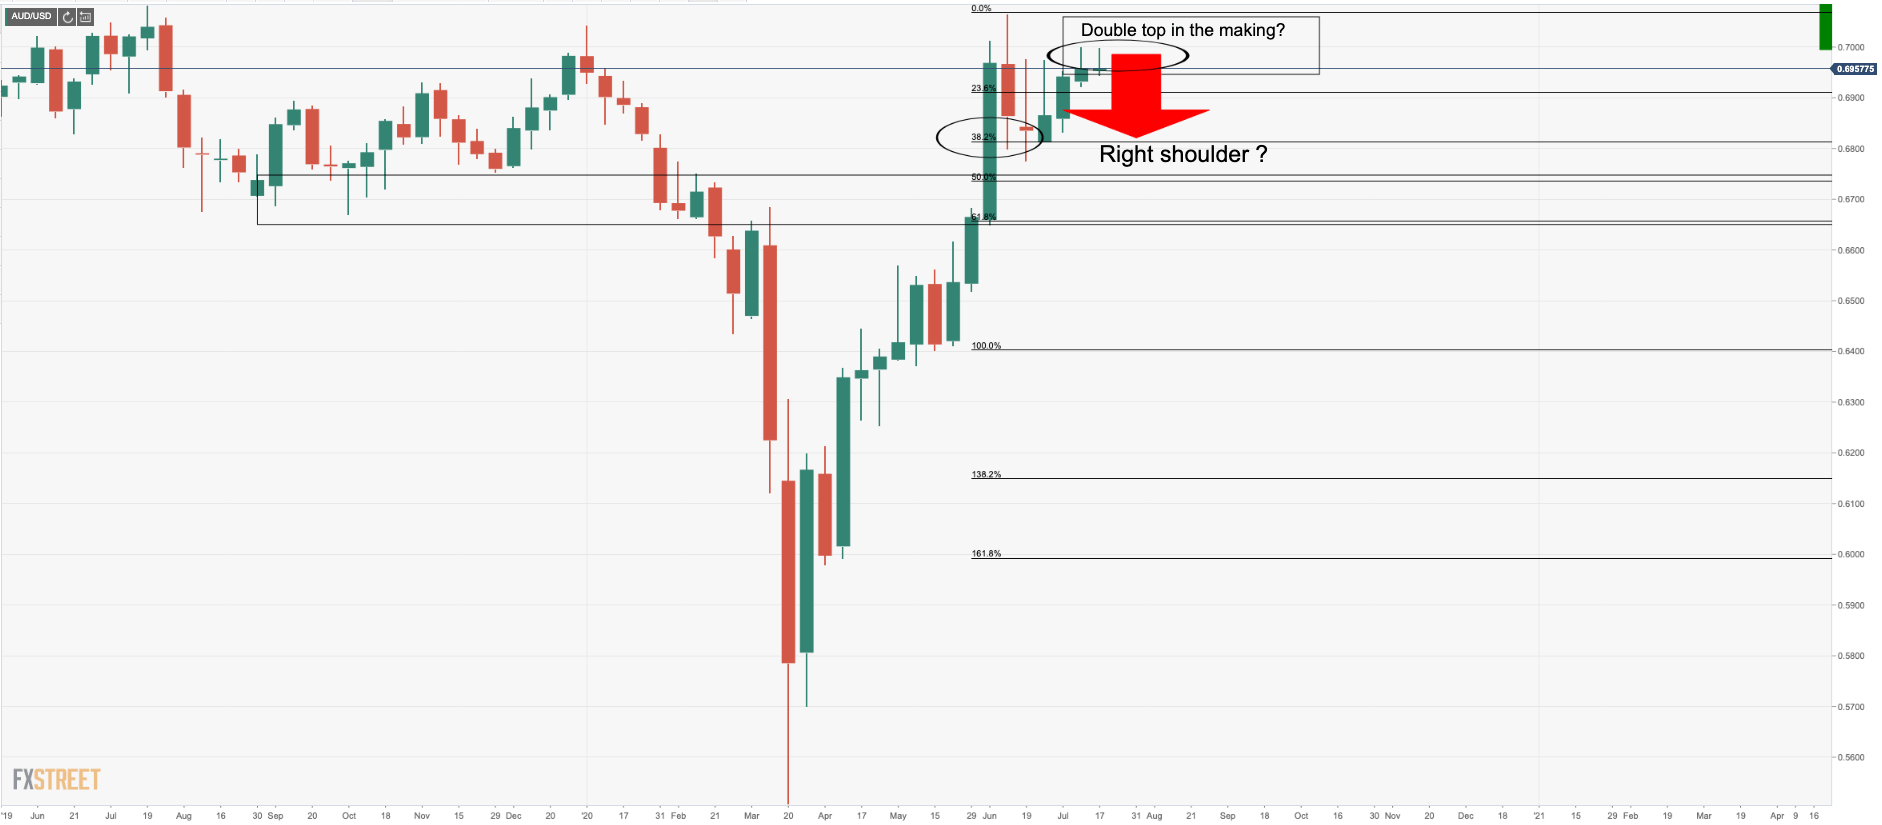
The weekly double top in the making
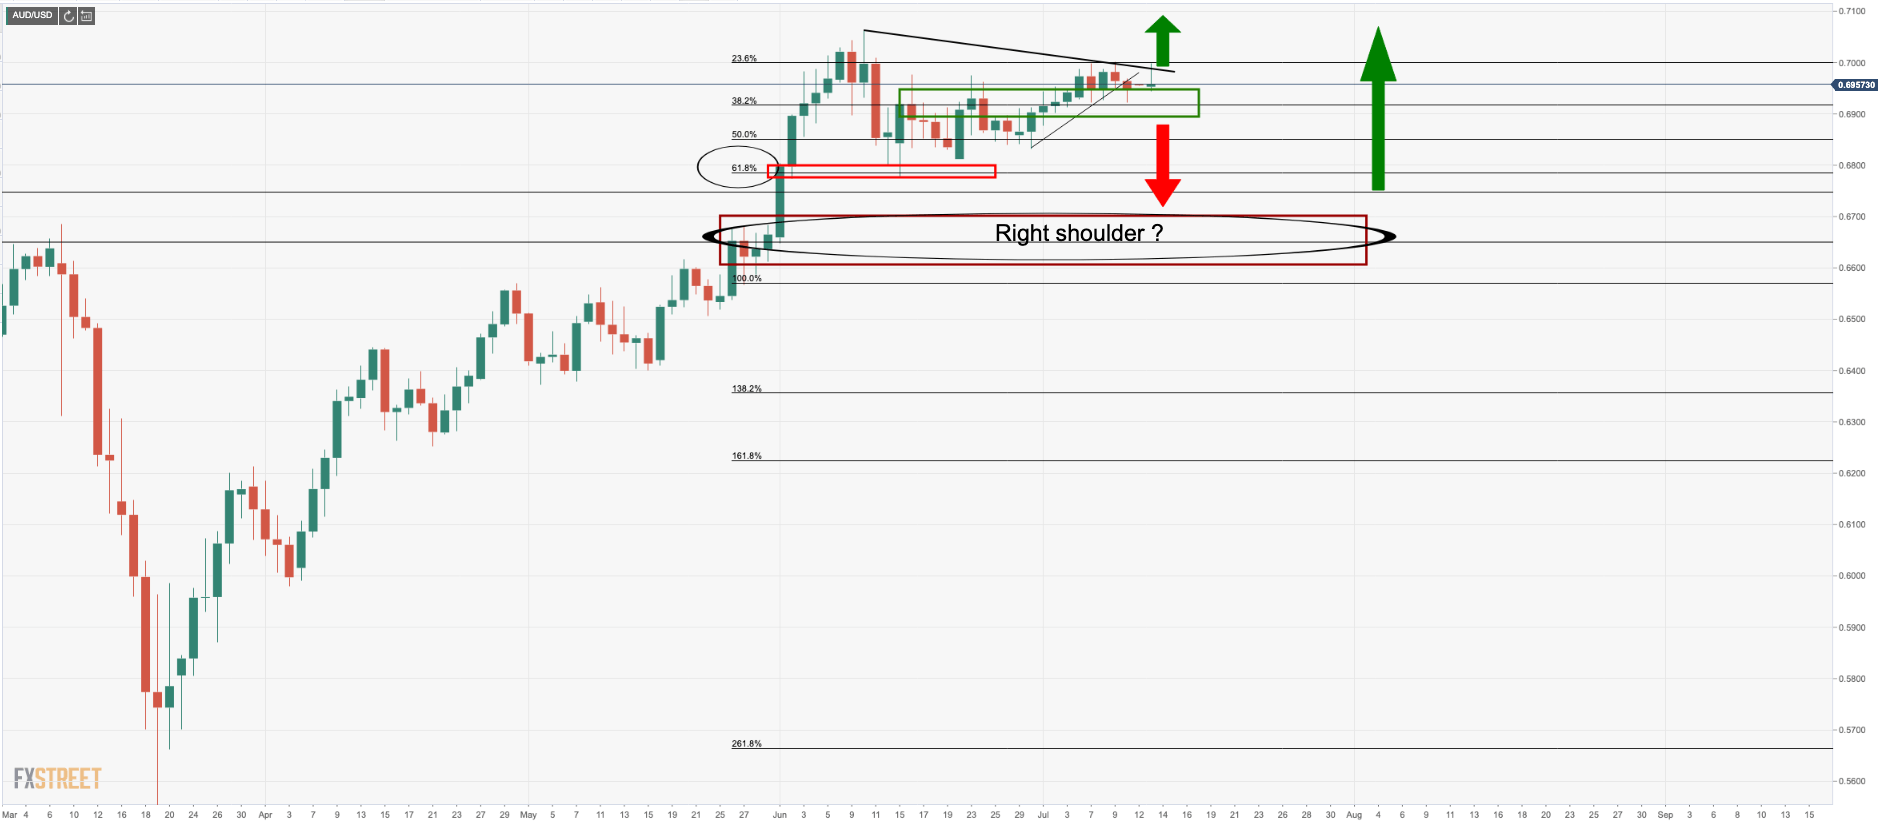
Bears seek break below daily bullish structure
4HR on the verge of turning bearish (MACD)
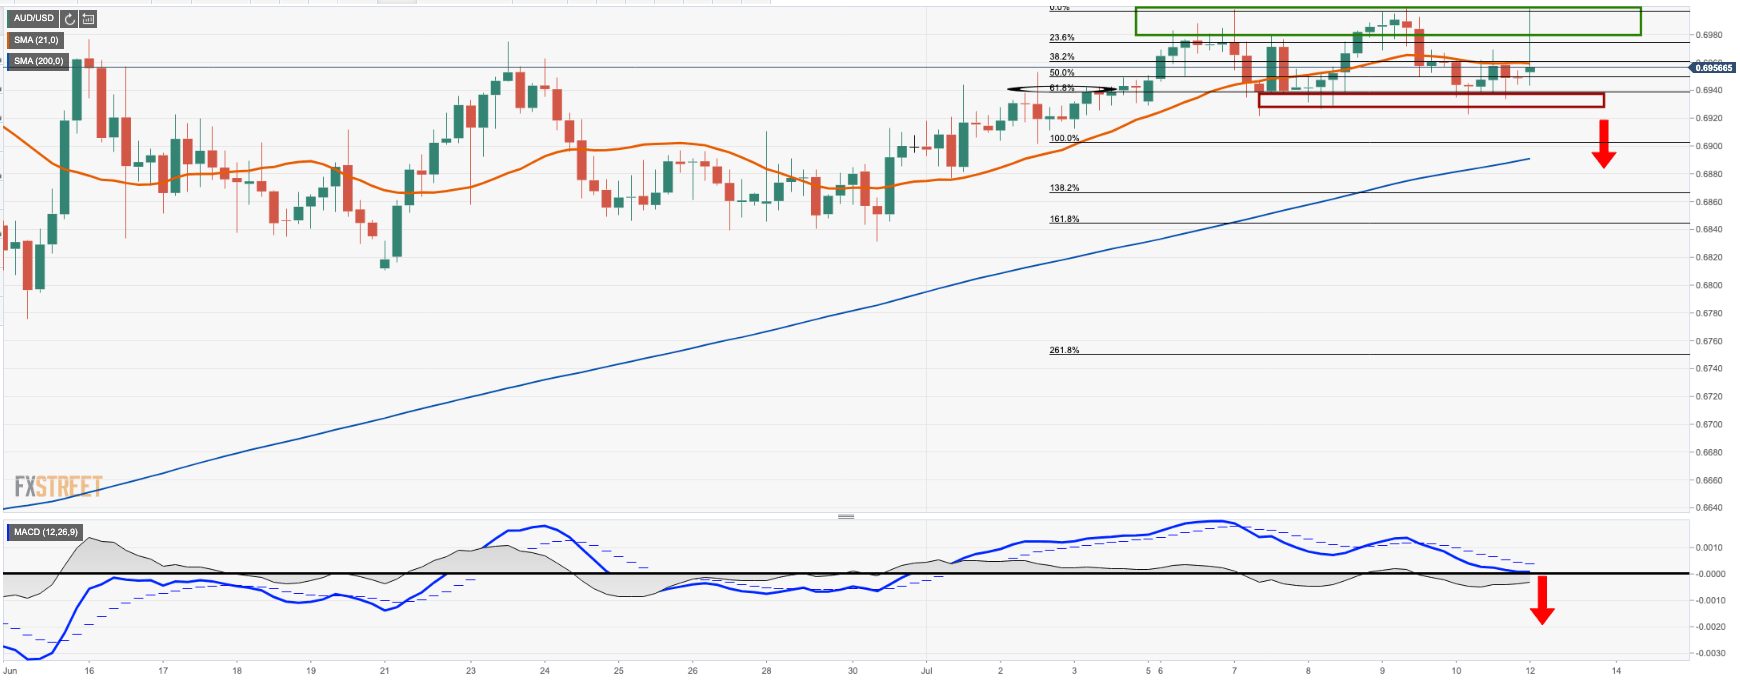
From a four hour perspective, MACD is still holding in bullish territory.

However, price is below the 21 4-hour moving average and a break below the zero line would pressure the support structure and open prospects of a run towards the 200 4-hour moving average. 

A series of tests below the 200 4-hour moving average and what will become a confluence with a 161% Fib retracement at the near-term support structure will open the prospects for completion of the distribution phase.

This is where the right shoulder of the month head and shoulders will be made over a series of consolidation. 
Author

Ross J Burland

Ross J Burland, born in England, UK, is a sportsman at heart. He played Rugby and Judo for his county, Kent and the South East of England Rugby team.


More from Ross J Burland
Share:

Editor's Picks

GBP/USD turns negative; slips back to 1.3530

GBP/USD comes under pressure and weakens toward the 1.3530 zone on Tuesday. Cable thus leaves behind two daily upticks in a row and retreats further from Monday’s multi-week tops past 1.3570 following humble gains in the Greenback and disheartening UK jobs data.

EUR/USD comes under pressure near 1.1570

EUR/USD could not sustain the earlier bullish attempt toward the proximity of 1.1600 the figure, coming under fresh downside pressure and revisiting the 1.1580-1.1570 band as the NA session draws to a close on Tuesday. The better tone in the US Dollar in the latter part of the day weighs on the pair amid steady volatility in the Middle East. Looking forward, the release of the FOMC Minutes takes centre stage on Wednesday.

Gold consolidates below $4,350; looks to FOMC Minutes for fresh impetus

Gold holds steady below $4,350, following the previous day's heavy losses, as traders await the release of FOMC Minutes for cues about the Fed's future policy path. In the meantime, the recent surge in US bond yields, bolstered by inflation fears stemming from rising oil prices, supports the US Dollar amid the Middle East crisis and should cap the non-yielding bullion.

Ethereum: Investors remain on the sidelines

Ethereum continued its consolidation pattern over the past week with several key on-chain and derivatives metrics indicating traders remain hesitant to return to the market. The holdings across several wallet cohorts remained largely unchanged over the past week. Wallets holding 10K-100K ETH, also classified as whales, saw modest inflows of only 10K ETH.

Fiscal concerns and doubts on Fed independence send US yields to long-term highs

US Treasury yields keep rising across the curve this week, with the yield for the 30-year Treasury bond reaching its highest level since 2007, during the global financial crisis, at 5.33% so far on Monday. A mix of concerns about the ballooning US fiscal deficit and growing doubts about the Federal Reserve’s Independence are increasing pressure on US Government Bonds.

Why is Crude Oil priced for a reopening the ships haven't made?
Fourteen vessels crossed the Strait of Hormuz on Tuesday. Before the war, the count ran near 120 a day. In the sessions since the waterway was publicly declared open, Brent has drifted back to $87 and West Texas Intermediate (WTI) to $81, both a little lower again on Wednesday, with daily momentum on each unwound from the top of its range in late July to the low twenties now.