|

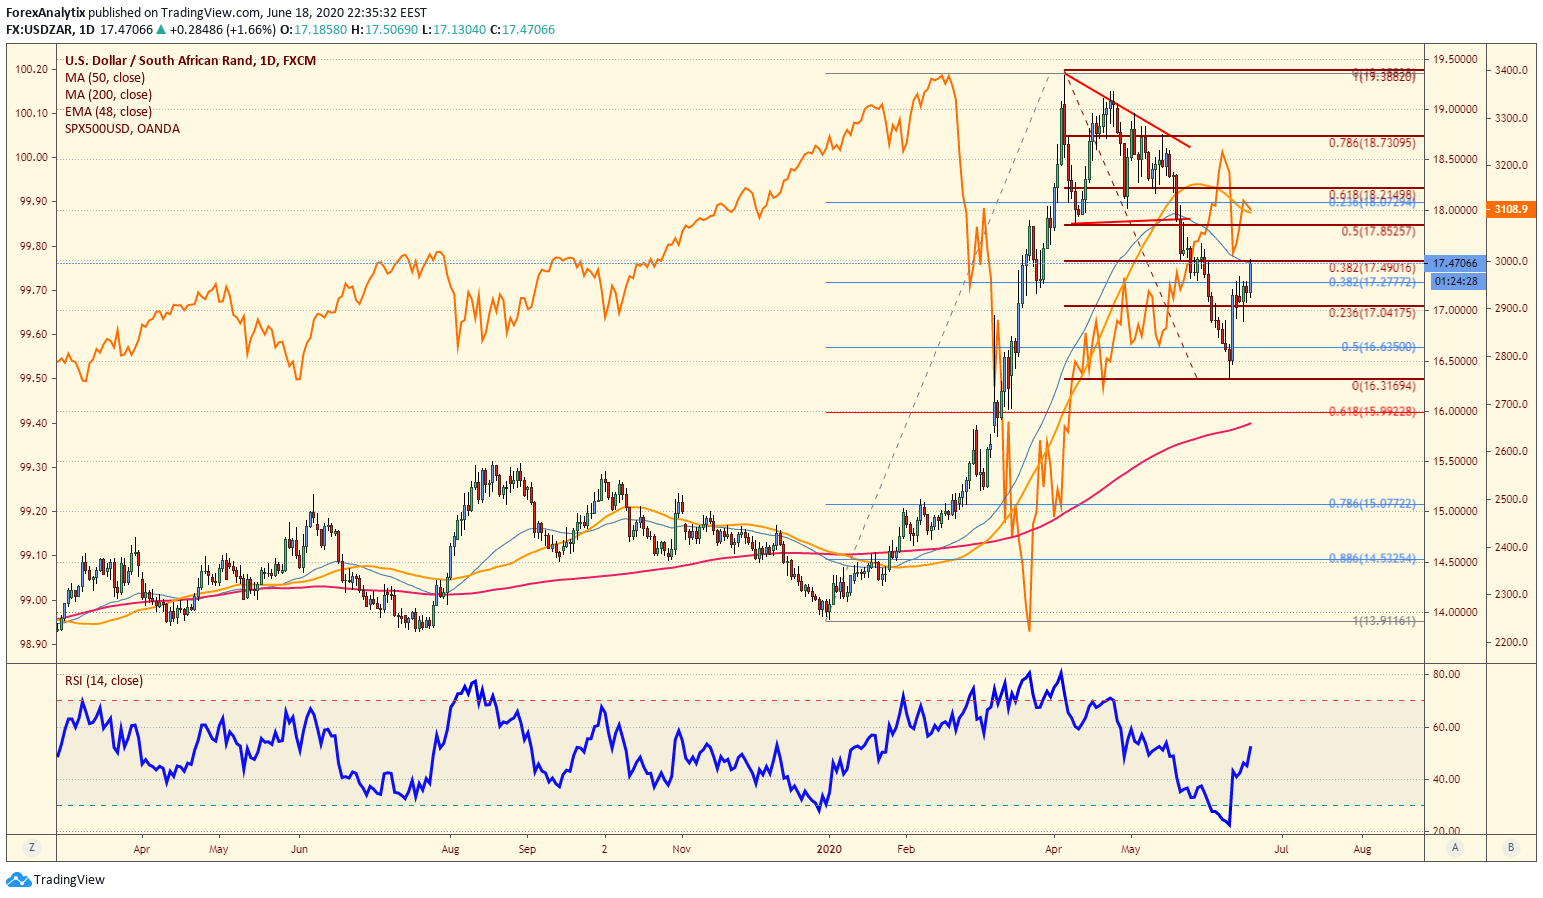
Chart of the Day: USDZAR

The USDZAR is breaking higher after pulling back a little over the 50% retracement of the Dec 2019 lows to March 2020 highs. The rally (currently) has reached the 38% Fibonacci retracement, but the RSI suggests we may have higher to go. If this is the case, we may have to keep an eye on the SPX (overlayed in orange) which has not flinched at the idea that the ZAR is under pressure. However, when the EM (emerging market) currencies like the ZAR, MXN, TRY, RUB etc are under pressure it could be signalling that "risk aversion" may be coming soon. With triple witching options expiration tomorrow, we need to keep a watchful eye on equity indexes and EM currencies. 

Author

Blake Morrow

Blake Morrow

Forex Analytix

Blake Morrow spent most of his professional career as the Chief Currency Strategist for Wizetrade group for 15 years, and then the Senior Currency Strategist for Ally Financial after the acquisition of Tradeking which owned the Wizetrade Group.

More from Blake Morrow
Share:

Markets move fast. We move first.

Orange Juice Newsletter brings you expert driven insights - not headlines. Every day on your inbox.

By subscribing you agree to our Terms and conditions.

Editor's Picks

EUR/USD clings to small gains near 1.1750

Following a short-lasting correction in the early European session, EUR/USD regains its traction and clings to moderate gains at around 1.1750 on Monday. Nevertheless, the pair's volatility remains low, with investors awaiting this weeks key data releases from the US and the ECB policy announcements.

GBP/USD edges higher toward 1.3400 ahead of US data and BoE

GBP/USD reverses its direction and advances toward 1.3400 following a drop to the 1.3350 area earlier in the day. The US Dollar struggles to gather recovery momentum as markets await Tuesday's Nonfarm Payrolls data, while the Pound Sterling holds steady ahead of the BoE policy announcements later in the week.

Gold stuck around $4,300 as markets turn cautious

Gold loses its bullish momentum and retreats below $4,350 after testing this level earlier on Monday. XAU/USD, however, stays in positive territory as the US Dollar remains on the back foot on growing expectations for a dovish Fed policy outlook next year.

Solana consolidates as spot ETF inflows near $1 billion signal institutional dip-buying

Solana price hovers above $131 at the time of writing on Monday, nearing the upper boundary of a falling wedge pattern, awaiting a decisive breakout. On the institutional side, demand for spot Solana Exchange-Traded Funds remained firm, pushing total assets under management to nearly $1 billion since launch. 

Big week ends with big doubts

The S&P 500 continued to push higher yesterday as the US 2-year yield wavered around the 3.50% mark following a Federal Reserve (Fed) rate cut earlier this week that was ultimately perceived as not that hawkish after all. The cut is especially boosting the non-tech pockets of the market.

Solana Price Forecast: SOL consolidates as spot ETF inflows near $1 billion signal institutional dip-buying

Solana (SOL) price hovers above $131 at the time of writing on Monday, nearing the upper boundary of a falling wedge pattern, awaiting a decisive breakout.