|

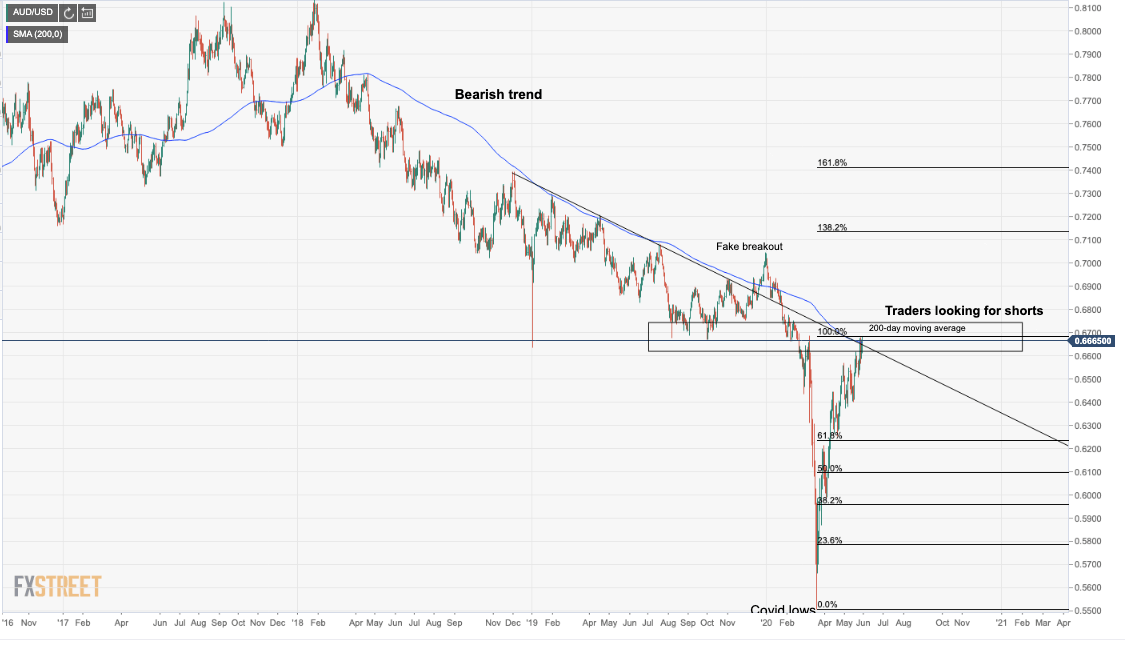
Chart of the day: AUD/USD is at make-or-break resistance, 0.6400 or 0.6820

AUD/USD is at make-or-break resistance where the price has recovered from the COVID-19 bear trend, retracing it in full and meets the 200-DMA, trendline resistance and prior daily support structure. 

The recent escalation of a war of words between the US and China could not have come at a worst time for the bulls hoping for a prolonged uptrend.

However, the environment remains bullish from a purely technical standpoint, although weak hands will likely wish to reduce positions and take profit. For an upside extension, a stop-run clear-out through resistance and a bar-room brawl may need to take place first. 

AUD/USD daily chart: Bulls meet confluence resistance area

Upside targets

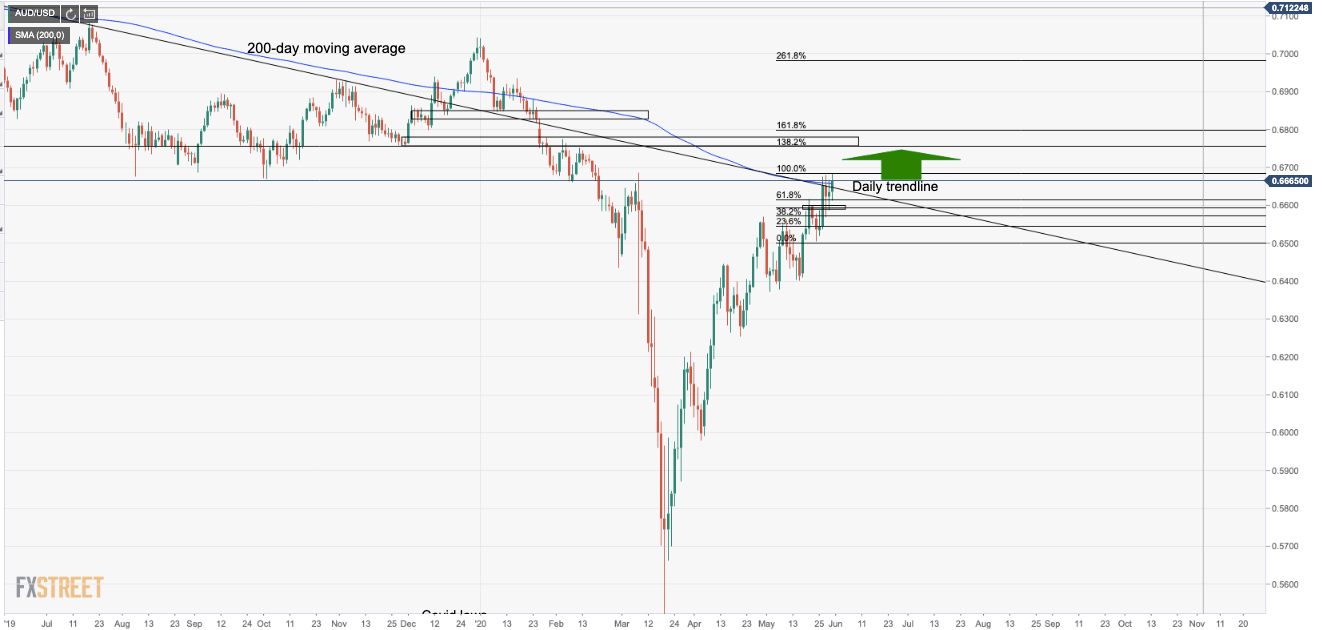
A break of the trendline brings in the prior support structures and Fibos. The Fibonacci with most confluence comes as the 138.2% at 0.6757. A stretch to the 161.8% at 0.68 the figure is feasible, just below the neckline of the Dec-Feb H&S, 0.6826.

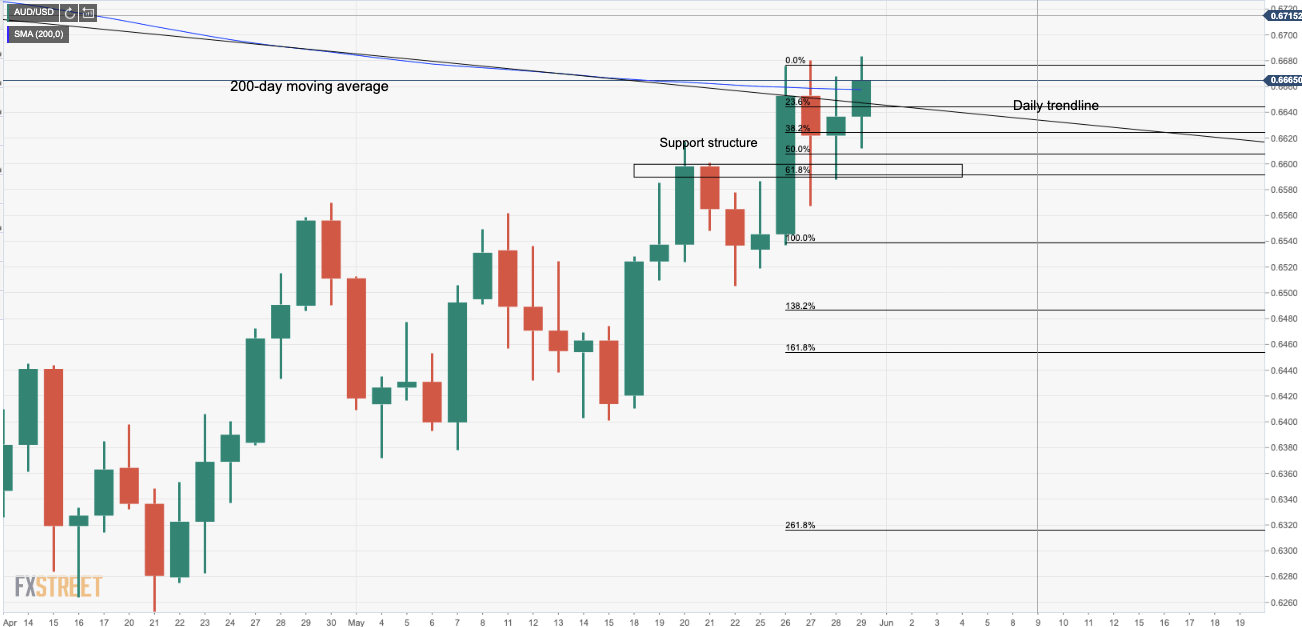
Bulls holding above support structure

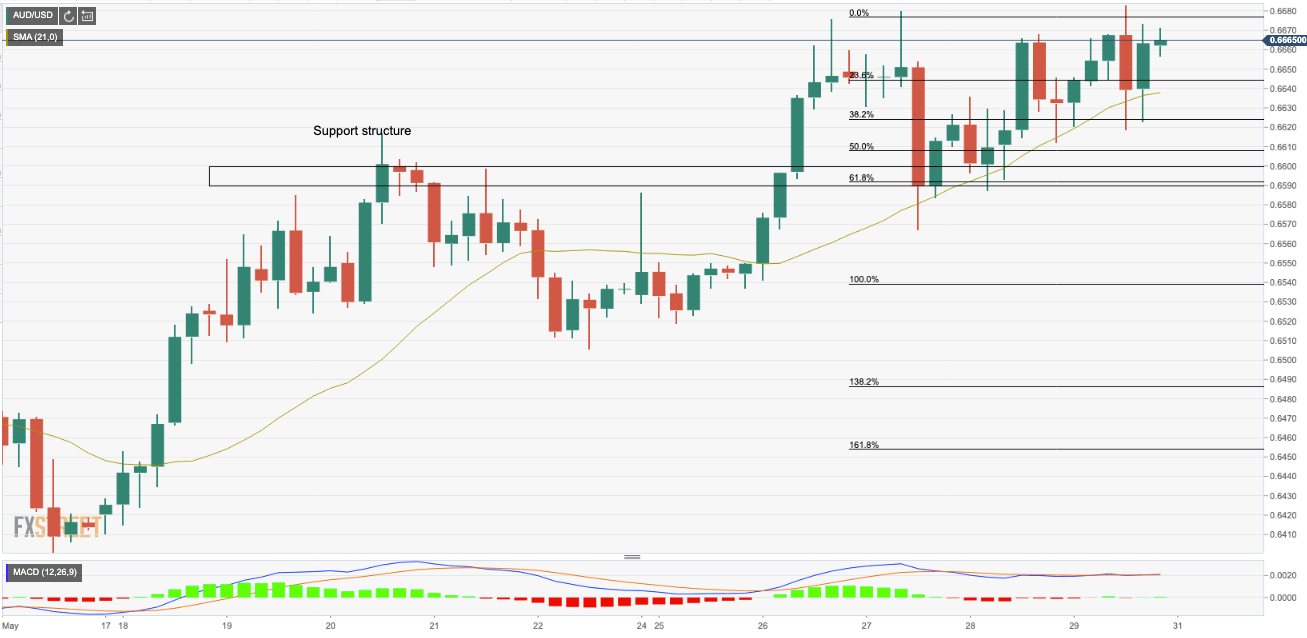
Bullish 4-HR environment

At this point, it is not the cheapest entry-level and bulls will be looking for a discount prior to boarding this train very late in the trend. More often than not, it takes a few attempts to break trend lines, especially when there is a confluence of so may resisting factors, such as the 200-DMA and prior support structure.  Instead, a bearish case should be considered. 

Short on a break below support structure, stop above recent highs and 200-DMA/trendline resistance: 

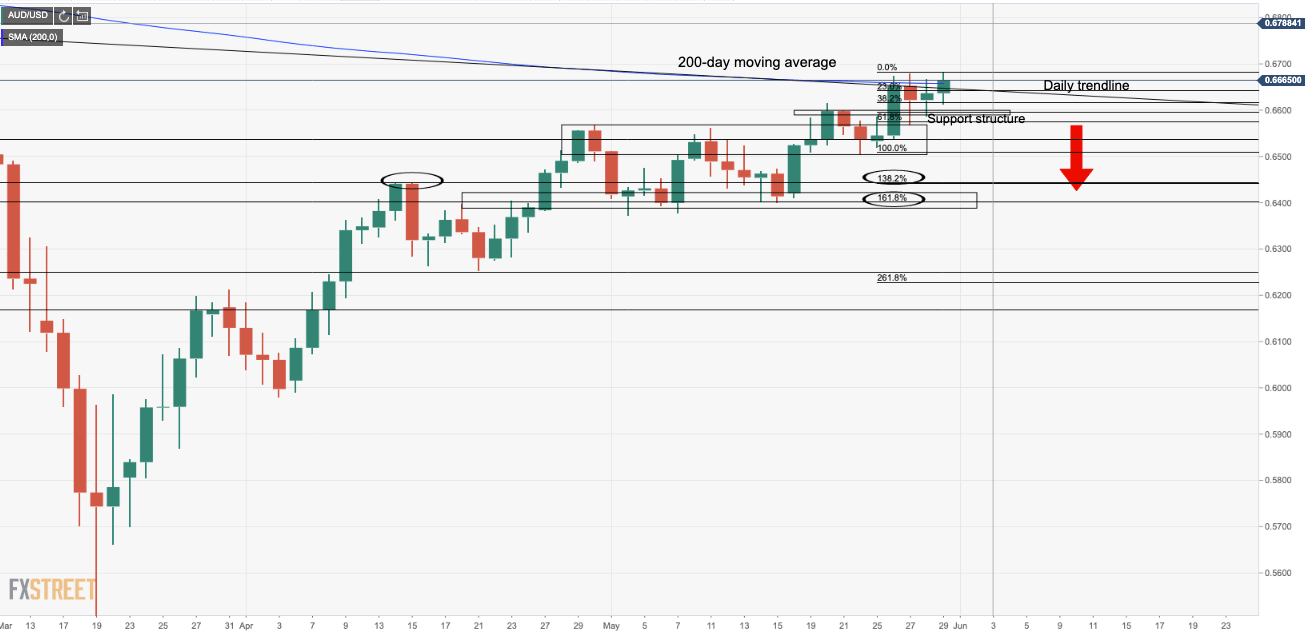
0.6400 meets the 161.8% Fibonacci extension and prior support structure. 0.6450 is a prior target on the way there with the 138.2% and April highs. 

Author

Ross J Burland

Ross J Burland, born in England, UK, is a sportsman at heart. He played Rugby and Judo for his county, Kent and the South East of England Rugby team.

More from Ross J Burland
Share:

Editor's Picks

EUR/USD accelerates losses, focus is on 1.1800

EUR/USD’s selling pressure is gathering pace now, opening the door to a potential test of the key 1.1800 region sooner rather than later. The pair’s pullback comes on the back of marked gains in the US Dollar following US data releases and the publication of the FOMC Minutes later in the day.

GBP/USD turns negative near 1.3540

GBP/USD reverses its initial upside momentum and is now adding to previous declines, revisiting at the same time the 1.3540 region on Wednesday. Cable’s downtick comes on the back of decent gains in the Greenback and easing UK inflation figures, which seem to have reinforced the case for a BoE rate cut in March.

Gold picks pace, flirts with $5,000

Gold is back on the front foot on Wednesday, shaking off part of the early week softness and pushing higher towards the key $5,000 mark per troy ounce. The move comes ahead of the FOMC Minutes and is unfolding despite an intense rebound in the US Dollar.

Fed Minutes to shed light on January hold decision amid hawkish rate outlook

The Minutes of the Fed’s January 27-28 monetary policy meeting will be published today. Details of discussions on the decision to leave the policy rate unchanged will be scrutinized by investors.

Mixed UK inflation data no gamechanger for the Bank of England

Food inflation plunged in January, but service sector price pressure is proving stickier. We continue to expect Bank of England rate cuts in March and June. The latest UK inflation read is a mixed bag for the Bank of England, but we doubt it drastically changes the odds of a March rate cut.

Sui extends sideways action ahead of Grayscale’s GSUI ETF launch

Sui is extending its downtrend for the second consecutive day, trading at 0.95 at the time of writing on Wednesday. The Layer-1 token is down over 16% in February and approximately 34% from the start of the year, aligning with the overall bearish sentiment across the crypto market.