Cautious FOMC minutes put the dollar under pressure
Market Overview
The dollar is under pressure this morning after a cautious set of FOMC minutes have just pulled the reins slightly on expectations of a June hike. The committee wants to make sure that the slowdown in Q1 is just transitory and this would suggest it is looking at the data. However the concern would be that the data has been fairly mixed of late, with yesterday’s existing home sales another disappointment. This has just hit Treasury yields, with the two year yield back below 1.300% and the 10 year also dropping back. The US dollar dropped across the major pairs and the move also helped to support commodities such as gold and silver. There was also another interesting takeaway from the minutes, which talked about balance sheet reduction for the first time. The Fed will put a cap on the reduction and any amount of bonds maturing above the cap would be reinvested. This is positive for equity markets as it suggests a gradual and controlled wind down of the balance sheet.

Wall Street closed positively last night with the S&P 500 +0.2% at 2404 which was a record close, whilst Asian markets were also higher (Nikkei +0.4%). European indices are also looking supported in early moves. In forex trading the dollar remains under pressure across the majors, however it is interesting to see the yen being the main underperformer. Positive market sentiment is also holding back gold which is all but flat on the day, whilst oil is around a percent higher ahead of today’s OPEC meeting amid suggestions that Iran and Iraq both support a nine month extension to the production cuts..
The biannual OPEC meeting in Vienna will take a large degree of focus for traders today, and it will be interesting to see the emphasis that traders put on the cartel which is now less than a third of global supply. Updates will come throughout the day. The announcement of the second estimate of UK Q1 2017 GDP growth at 0930BST. Quarterly growth is expected to remain steady at the prelim reading of +0.3%, however, interestingly the year on year growth is expected to see a mild upward revision to +2.1% (from +2.0%). US weekly jobless claims are at 1330BST and are expected to see an increase to 238,000 (from 232,000 last week). After the Richmond Fed manufacturing index disappointed earlier in the week there will also be focus on the Kansas City Fed composite at 1600BST which fell back to 7 last month. Today is also public holiday in France, Germany and Switzerland.
Chart of the Day – Silver
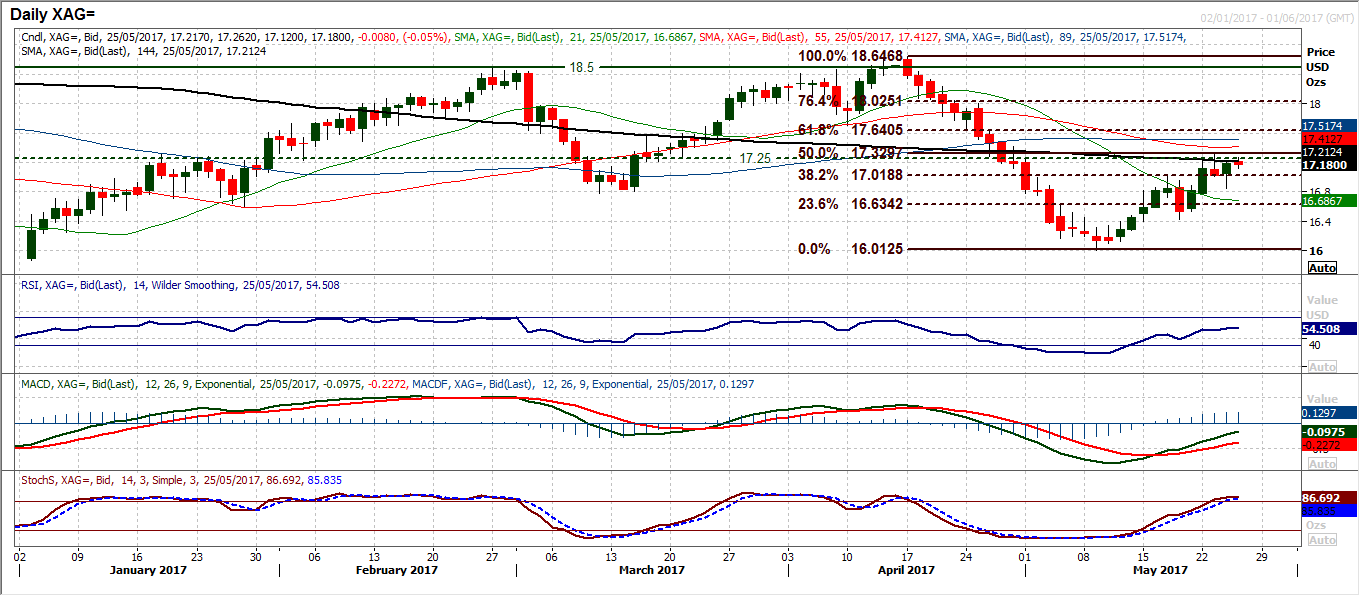
Silver has rallied strongly in the past couple of weeks as it has rebounded from the May low at $16.01. Since October last year, there has been a key pivot in the price around $17.25 which has been used on numerous occasions. However the market is now showing signs once more of consolidating around this pivot and a crossroads has been reached. On Tuesday, the price rallied to $17.30 prior to dropping back. The day high also came around the 50% Fibonacci retracement of the $18.65/$16.01 sell-off at $17.33. Consolidations around this $17.25 pivot have been frequent in the last eight months, so the market appears to have approached a medium term crossroads once more. For months now the price has broadly ranged between key long term levels $16/$18.50 and this could simply be another consolidation in the recovery towards the range highs again. Momentum indicators are unwinding a negative medium term outlook but continue to improve. The RSI is around 50 whilst the Stochastics have already reached 80 but the MACD are still struggling to unwind. The reaction around this $17.25 mid-range pivot will be key. The hourly chart shows support at $16.85 before $16.43. Closing above $17.31 re-opens the recovery upside with next real resistance at $18.00.
EUR/USD
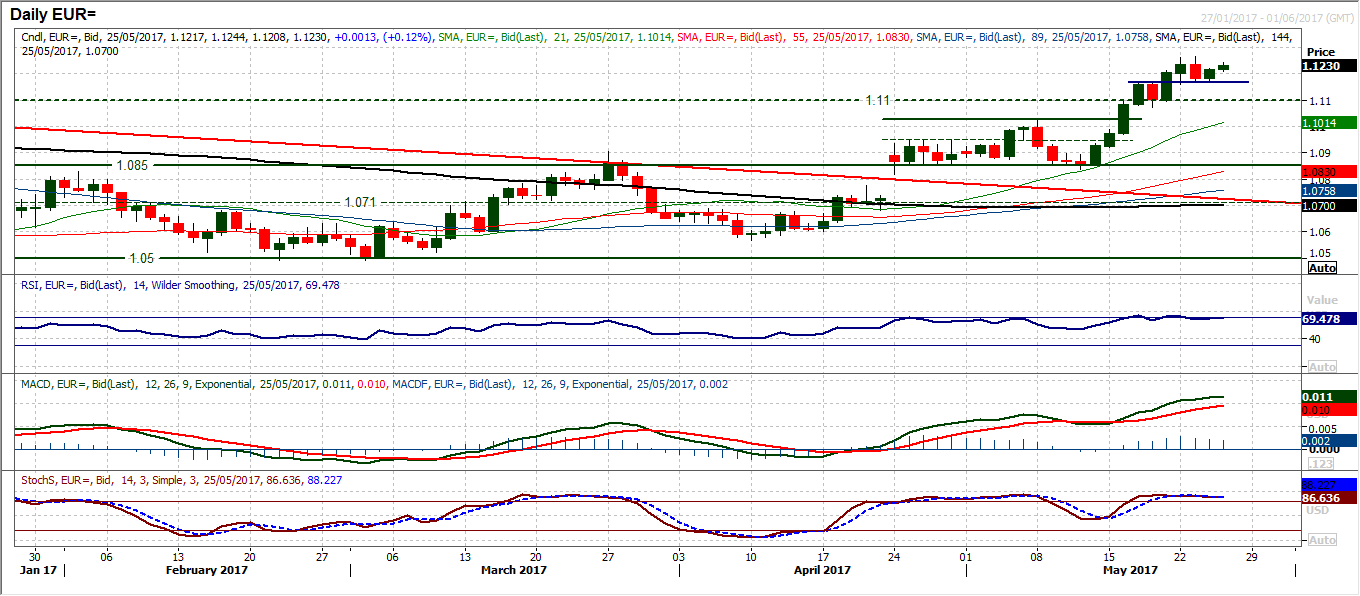
The bulls may have left it late yesterday but they came back in to drive the pair higher in the wake of the Fed minutes to post a positive candle and help to re-establish control. The early gains today also help to support the assertion that corrections continue to be bought into at higher levels. Having previously broken out above the long term pivot at $1.1100, this higher low seems to be forming around $1.1160 now. The momentum indicators are positively configured still and there is little reason not to back the bulls for further gains. The resistance at $1.1267 is now likely to be challenged. An upside break re-opens $1.1300 as the November resistance but the bulls remain on course for the medium term recovery target of $1.1350 in due course. The hourly chart shows positive configuration and any intraday dips will be seen as a chance to buy. An initial support is at $1.1200.
GBP/USD
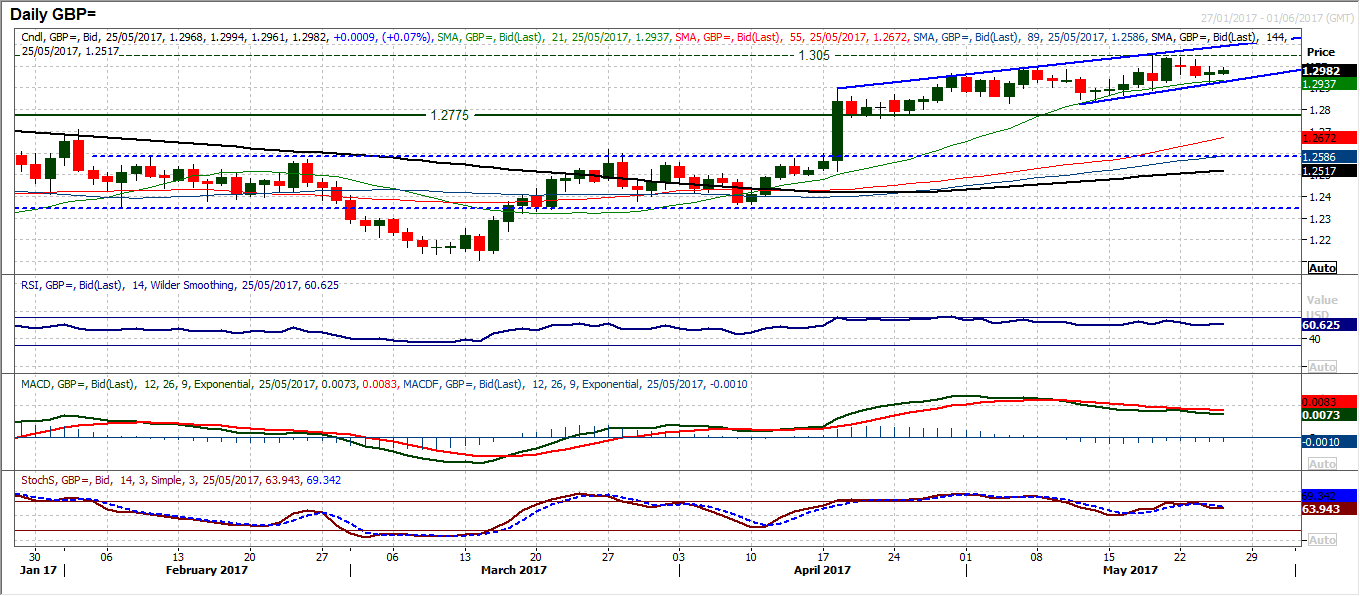
Despite the broadly negative dollar reaction to the Fed minutes, Cable has shown little real reaction. There has only been a minor rally which reflects the near term struggle that sterling continues to have. The rising 21 day moving average (currently $1.2937) has come in once more as a basis of support. The bulls will now be looking to leave another higher low at yesterday’s low of $1.2925. The last three daily candles have all had lower day highs, so a push above $1.2999 (yesterday’s high) will certainly be seen as re-engaging bull control. The attention will then turn to the resistance of the old pivot at $1.3050 which has held the rally back in the last week or so. Daily momentum remains positively configured without being overly strong, but is also a reflection of the fact that this seems to be a rally with the hand brake still on. The hourly chart shows a market straining to break the run of lower highs. Watch for the hourly RSI consistently above 60 and hourly MACD lines consistently above neutral for a sign of the bulls mounting a challenge.
USD/JPY
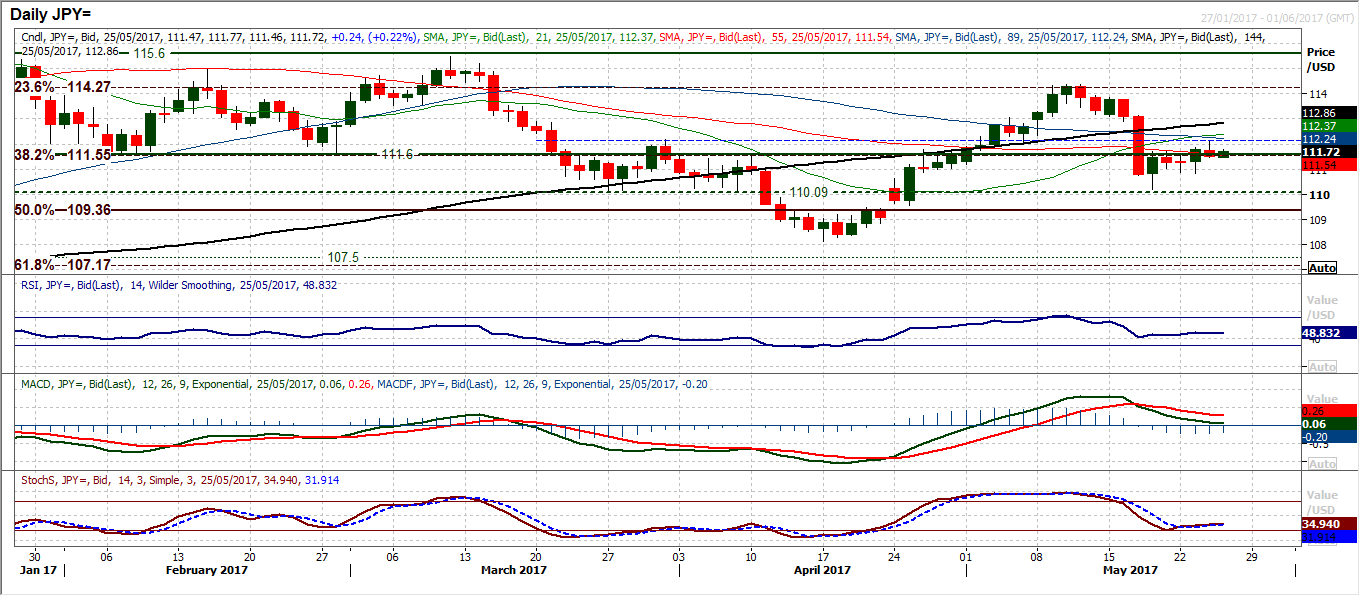
The corrective candle that completed in the wake of the dollar negative Fed minutes has now muddied the waters of a recovery. However all is not yet lost and if the bulls can sustain a position above the old 111.60 pivot then the outlook will maintain an improving path. The daily momentum indicators are tending to tick higher (RSI and Stochastics) but without significant impetus. However in the past week there has been a move towards higher lows and higher highs that shows a recovery is building. The support at 110.85 is now key to this, however a close back above 111.60 would also help to improve the outlook today. The hourly chart shows the market has unwound to a level where the bulls have regained control this week, with the hourly RSI in the high 30s and MACD lines around neutral. This needs to be where the bulls resume. A loss of yesterday’s low at 111.45 would begin to question the appetite to buy however the 110.85 support is key. Key near term resistance is at 112.20 still.
Gold
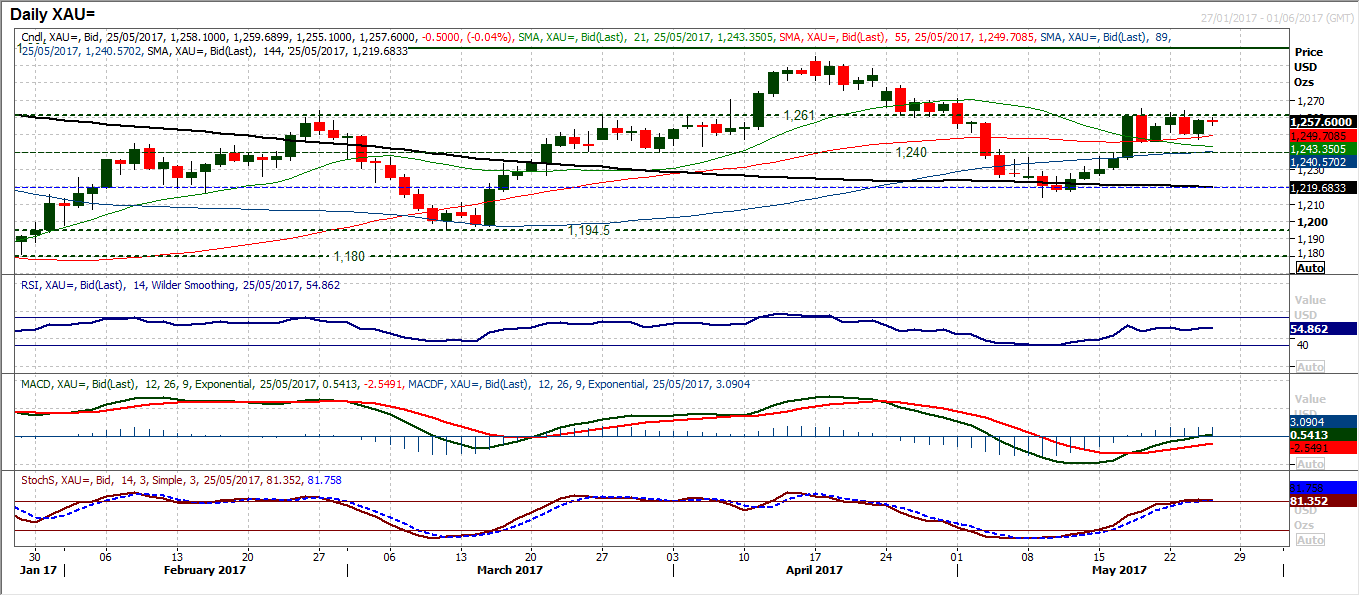
A mixed near term outlook is forming on gold as the market continues to consolidate between the $1240/$1261 pivots. A variety of bull and bear candles have been posted in the past week or so but the market is once more up towards a test of the medium term pivot at $1261. This has been a consistent barrier but is key to the bulls regaining control of gold. A closing breakout would open the April high of $1295. However the momentum indicators are not suggesting the bull momentum is building, more of one of continued consolidation. The RSI is plateaued just above 50, whilst the MACD lines have crept back to neutral and the Stochastics are stalling around 80. This does suggest a mild bullish bias, but whether the buying pressure can drive a breakout is another matter. On the hourly chart the picture is fairly similar, one of a mild positive configuration but without real strength. However the support at $1245 is strengthening and holding above a near term pivot at $1254 today will also help.
WTI Oil
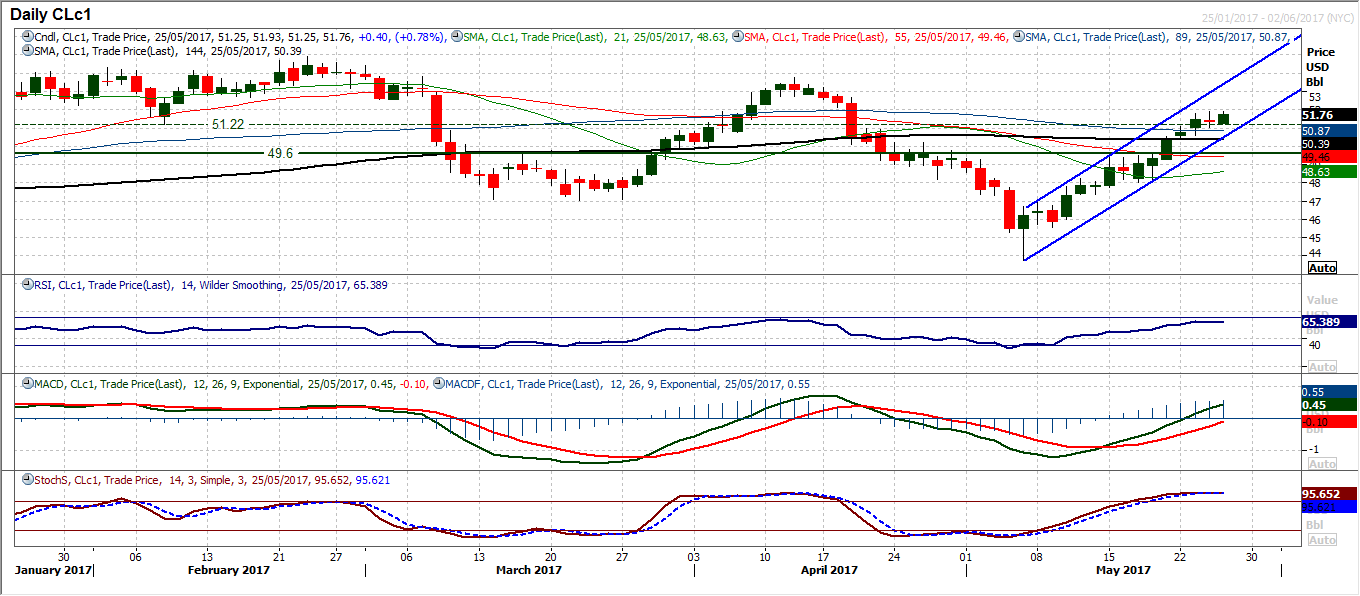
The reaction to the bigger than expected EIA crude oil inventory drawdown (-4.4m barrels) was somewhat muted, suggesting that traders are now positioned in preparation of the OPEC meeting today. However, a subdued candle from yesterday has given way to further gains overnight as the bulls continue to push higher. The technicals remain positive with the move through several key levels of overhead supply in front of the meeting. Clearing $51.22 has opened $53.75 and with momentum indicators strongly configured the move looks increasingly possible. However it is difficult to get away from the fact that the OPEC news today will drive the near to medium term outlook in the least. A longer than expected production cut (at least nine months) would be positive for oil. However, a middle of the road 6 months would likely be a touch underwhelming for a market that has rebounded so strongly of late.
Dow Jones Industrial Average
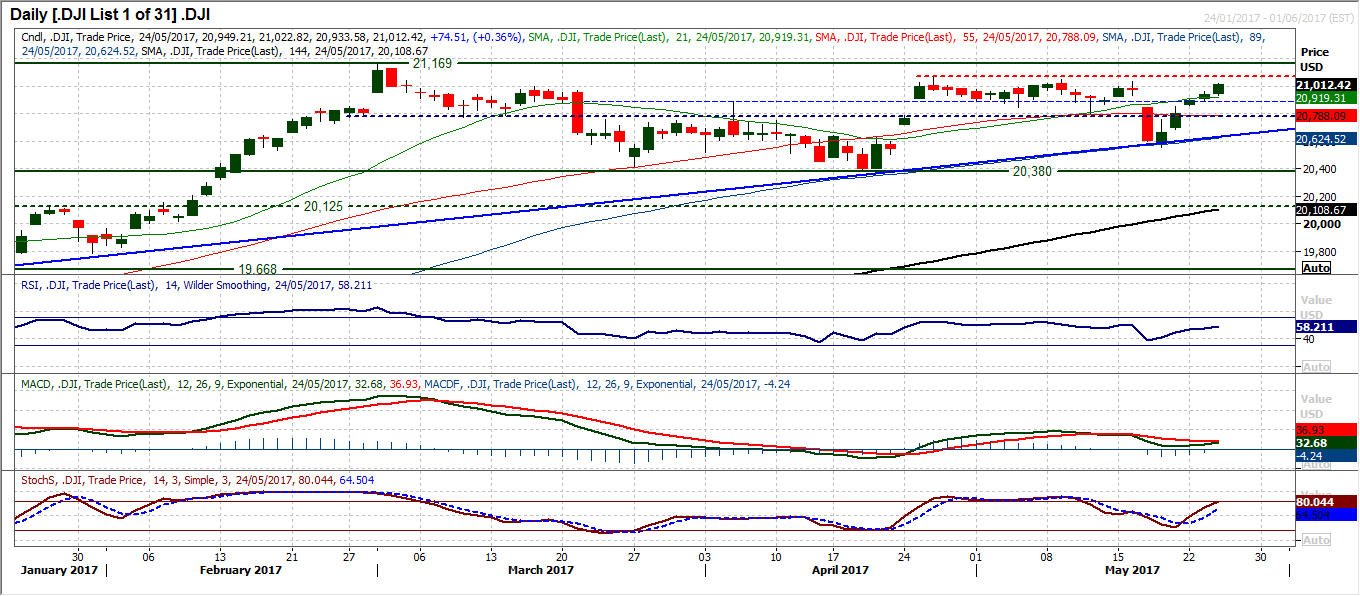
Posting a fifth consecutive positive candle, the Dow continues its slowly but surely rally. Having previously closed the gap at 20,933 the resistance between 21,033 and 21,070 is now open to be tested. However, it is also a concern that the market has really struggled to sustain a move above 21,000 in recent weeks, so look for last night’s closing breakout to be followed today by another to help confirm the move. The momentum indicators reflect a marginally positive configuration which is helping the bulls. The hourly chart also reflects this with positive momentum which will be needed to break the shackles of the resistance that still lays ahead. Above 21,070 opens the all time high at 21,169. With the old pivot at 20,888 now a basis of support, the area between the old pivots 20,780/20,888 is now becoming a decent buy zone for weakness.
Author

Richard Perry
Independent Analyst


