Cashing In On Chaos

Chaos Clinic for 2/28/2020
When the S&P turns down, the SH short S&P Exchange Traded Fund turns up. This was very clear this past week as the corona virus spooked investors.
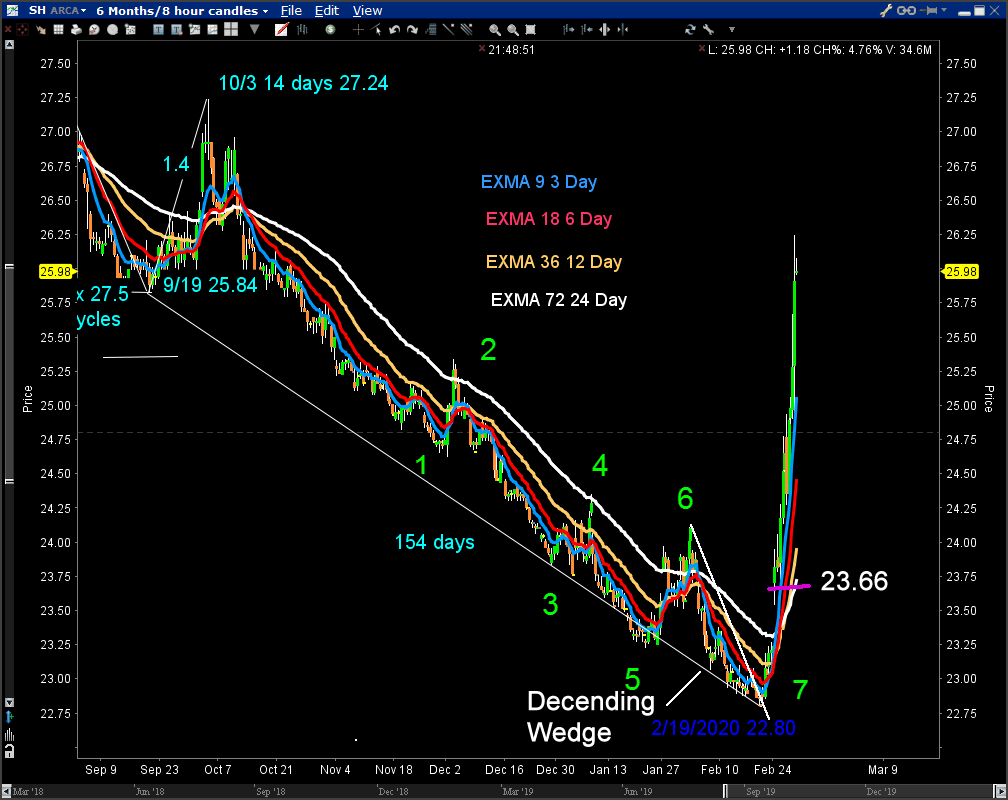
This chart is one I check daily as another way to look at what the S&P is doing. It helps me monitor the longer term trend, To aid in this, I use 8 hour bars, and a rainbow of EXMAs, set to 3, 6, 12, and 24 days.
This chart shows a down trend that began 10/3/2019. As it progressed, there was a clear seven move down Chaos Clamshell, shown by the green numbers 1-7. Move 7 formed a decending wedge, outlined in white. During the latter part of that wedge, I started buying SH. Then as the EXMA's started turning up, I bought more, until the prices gapped up, ending with an average price of 23.66 on 500 shares. With the low being 22.80, a 1 point stop at 22.66 limited my initial risk to $500.
It was easy to tell that this was a good entry, because all of the EXMAs turned up, and sharply. The longest EXMA, 24 days, is already above my entry. So I have moved my stop to 23.70, essentially break even.
With the drop from 10/3 taking 140 days, a simple equal time move would last 140 days, That would be July 8, 2020. With such a good entry, I can afford to wait to see how this plays out. I know that the evolving decline will take the form of a Chaos Clamshell, still in move 1.
Author

Dr. Al Larson, PhD
MoneyTide.com
Dr. Al Larson holds a Ph.D. in Electrical and Computer Engineering from the University of Wisconsin. He is a 1964 Distinguished Graduate of the U. S. Air Force Academy.


