Can you hear it? That’s the crowd booing gold’s downturn

Even though the technicals have been predicting this for several months, people were still taken aback by gold’s fall – that’s why they are booing.
While the precious metals received a round of applause for their performances in October, I warned on several occasions that the celebration was premature. And with gold, silver, and mining stocks resuming their 2021 downtrends, investors’ cheers have turned into jeers in short order.
To explain, I warned previously that the GDX ETF could rally to or slightly above $35 (the senior miners reached this level intraday on Nov. 12, moving one cent above it). However, with the GDX ETF’s RSI (Relative Strength Index) signaling overbought conditions, I highlighted just how quickly the air often comes out of the balloon. For context, the blue vertical dashed lines below depict the sharp reversals that followed after the GDX ETF’s RSI approached or superseded 70.
Why am I telling you this? To emphasize that what happened recently was neither random nor accidental. What you see is a true, short-term top that formed in tune with previous patterns. You also see a fake inverse head-and-shoulders formation that was invalidated. This means that the implications of what happened really are bearish.
Let’s check why and how, in tune with the past patterns, the previous broad top really was. Please see below:
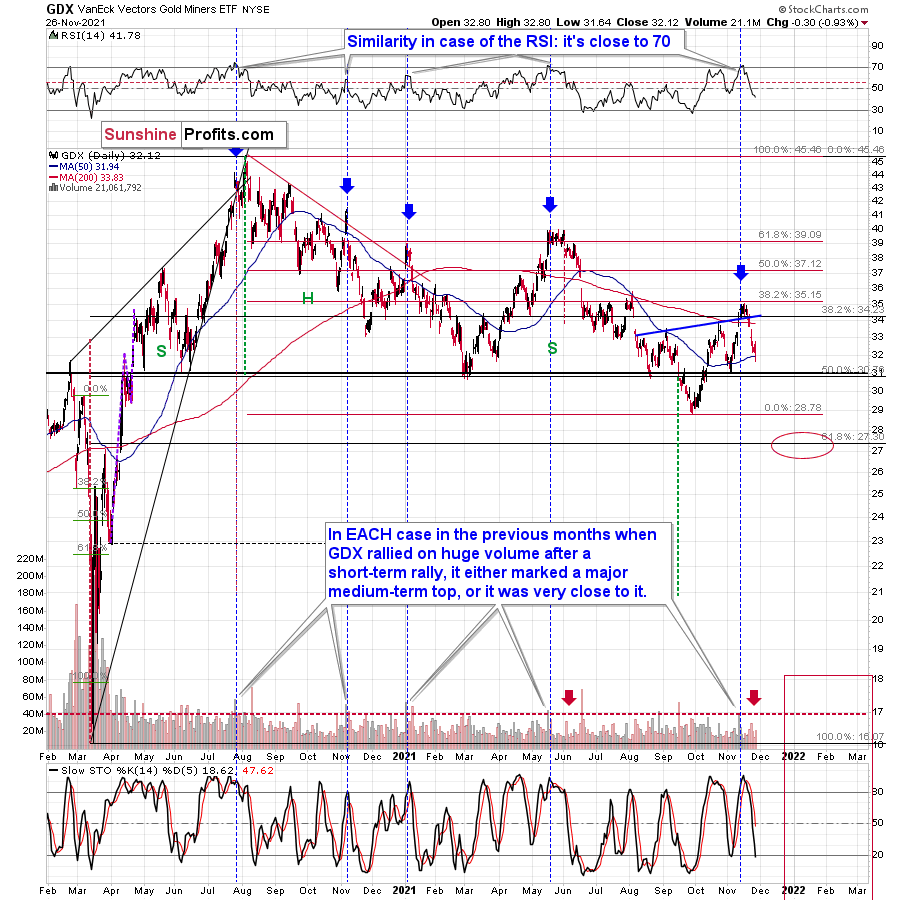
The GDX ETF rallied on huge volume on Nov. 11 and there were only 4 cases in the recent past when we saw something like that after a visible short-term rally.
In EACH of those 4 cases, GDX was after a sharp daily rally.
In EACH of those 4 cases, GDX-based RSI indicator (upper part of the chart above) was trading close to 70.
The rallies that immediately preceded these 4 cases:
1. The July 27, 2020 session was immediately preceded by a 29-trading-day rally that took the GDX about 42% higher. It was 7 trading days before the final top (about 24% of time).
2. The November 5, 2020 session was immediately preceded by a 5-trading-day rally that took the GDX about 14%-15% higher (the high-volume day/the top). It was 1 trading day before the final top (20% of time).
3. The January 4, 2021 session was immediately preceded by a 26-trading-day rally that took the GDX about 17%-18% higher (the high-volume day/the top). It was 1 trading day before the final top (about 4% of time).
4. The May 17, 2021 session was immediately preceded by a 52-trading-day rally that took the GDX about 30% higher. It was 7 trading days before the final top (about 13% of time).
So, as you can see these sessions have even more in common than it seemed at the first sight. The sessions formed soon before the final tops (4% - 24% of time of the preceding rally before the final top), but the prices didn’t move much higher compared to how much they had already rallied before the high-volume sessions.
Consequently, since history tends to rhyme, it would have been only natural for one to expect the GDX ETF to move a bit higher here (but not significantly so) and for one to assume that this move higher would take between additional 0 to 7 trading days (based on the Nov. 12 session). That’s what is wrote to my subscribers – to expect this kind of performance.
The final top formed on Nov. 16 - 4 trading days after the huge-volume session, practically right in the middle of the expected 0-7 trading day range.
Moreover, since the GDX topped very close to its 38.2% Fibonacci retracement, it seems that miners corrected “enough” for another huge downswing to materialize.
Having said that, let’s move on to more recent developments.
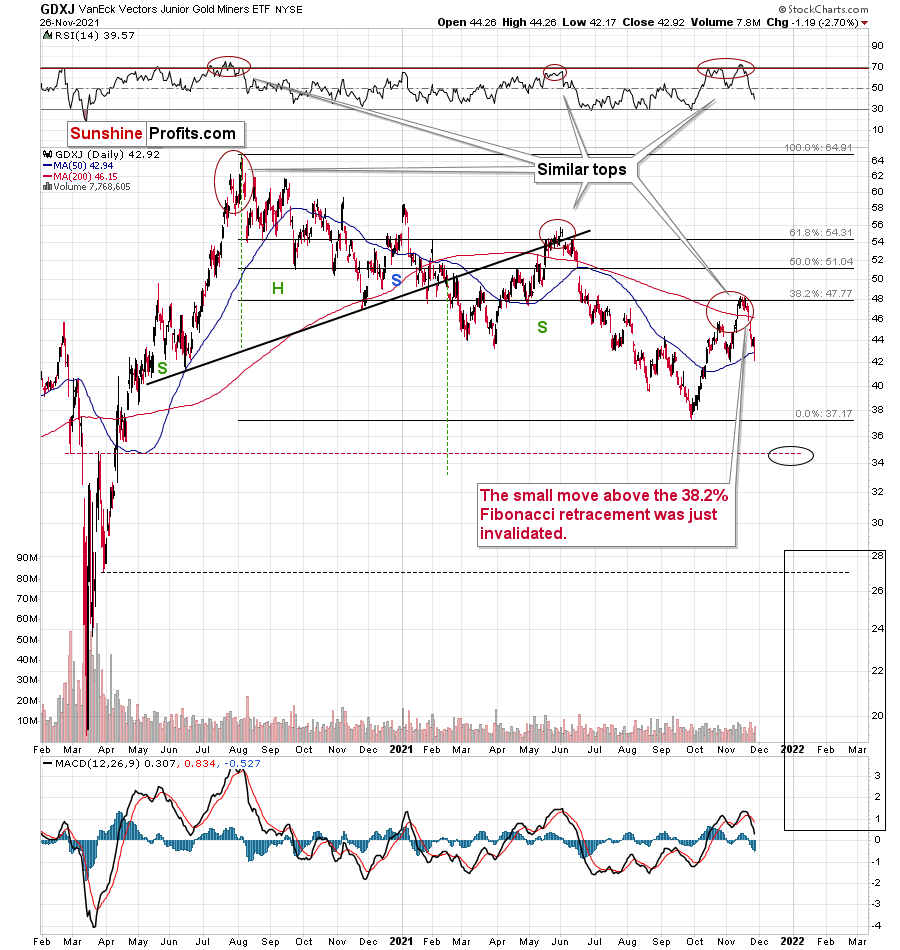
Gold price declined heavily recently and the same goes for the silver price. What’s more, the proxy for junior mining stocks - the GDXJ ETF (our short position) materially underperformed on Nov. 26 – after it declined by nearly 3x the percentage of the GDX ETF – and, in my opinion, more downside is likely to materialize over the medium term.
The GDXJ ETF ended the Nov. 26 session slightly below its 50-day moving average, and the milestone is often a precursor to sharp drawdowns. That’s what happened in late February 2020 and also in mid-June 2021. Big declines followed in both cases.
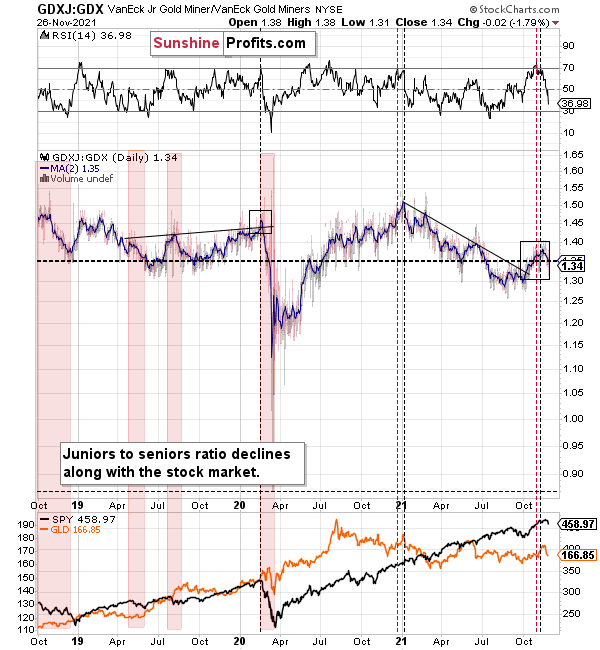
Moreover, with the S&P 500’s weakness on Nov. 26 mirroring the onslaught that unfolded in early 2020, the GDXJ ETF’s underperformance follows a familiar script. As a result, another ‘flash crash’ for the pair may unfold once again.
Keep in mind, though: while asset prices often don’t move in a straight line, a bullish pause may ensue if/once gold reaches its previous lows. All in all, though, lower lows should confront the GDXJ ETF over the short term and my $35 price target remains up to date. As a reminder, that’s only an interim target, analogous to the late Feb. 2020 low. Interestingly, it is the February 2020 low along with its late-March 2020 high that created this target.
Also, the GDXJ/GDX ratio is falling once again. And with the price action implying that the GDXJ ETF is underperforming the GDX ETF, a drop below 1 isn’t beyond the realms of possibility. In fact, it’s quite likely. As such, this is why I’m shorting the junior mining stocks.
For context, I think that gold, silver and the GDX ETF are all ripe for sharp re-ratings over the medium term. However, I think that the GDXJ ETF offers the best risk-reward proposition due to its propensity to materially underperform during bear markets in the general stock market.
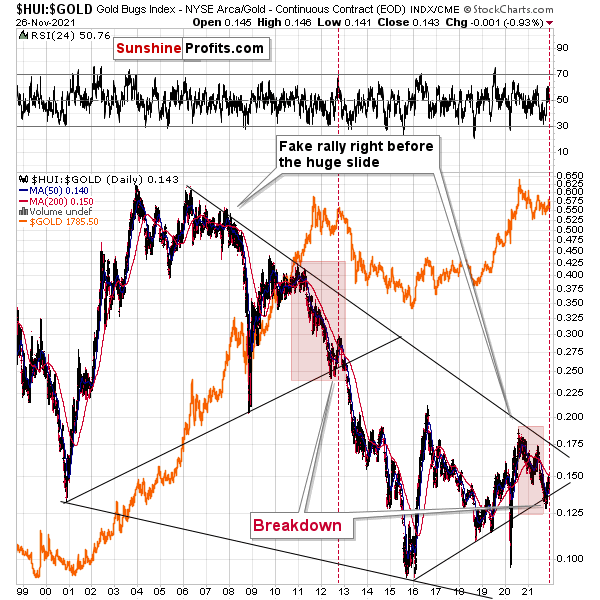
Finally, the HUI Index/gold ratio is also eliciting bearish signals. For example, I marked (with the shaded red boxes below) just how similar the current price action is to 2013. And back then, after a sharp decline was followed by a small corrective upswing before the plunge, the ratio’s current behavior mirrors its historical counterpart.
What’s more, the end of the corrective upswing in 2013 occurred right before gold sunk to its previous lows (marked with red vertical dashed lines in the middle of the chart below). Thus, the ratio is already sending ominous warnings about the PMs’ future path.
In addition, with the S&P 500 acting as the bearish canary in the coal mine, the ratio plunged in 2008 and 2020 when the general stock market tanked. Thus, if a similar event unfolds this time around, the gold miners’ sell-off could occur at a rapid pace.
For more context, I wrote previously:
A major breakdown occurred after the HUI Index/gold ratio sunk below its rising support line (the upward sloping black line on the right side of the chart above). Moreover, with the bearish milestone only achieved prior to gold’s crash in 2012- 2013, the ratio’s breakdown in 2013 was the last chance to short the yellow metal at favorable prices. And while I’ve been warning about the ratio’s potential breakdown for weeks, the majority of precious metals investors are unaware of the metric and its implications. As a result, investors’ propensity to ‘buy the dip’ in gold will likely backfire over the medium term.
In conclusion, the crowd has turned on the precious metals, and the narrative has shifted once again. However, despite all of the drama and the volatility that came with it, the technicals have been predicting this outcome for several months. And with the GDXJ ETF down by more than 20% YTD (as of the Nov. 26 close), the junior miners’ 2021 performance is far from critically-acclaimed. As a result, the chorus of boos will likely continue over the short- and/or medium-term.
Want free follow-ups to the above article and details not available to 99%+ investors? Sign up to our free newsletter today!
Want free follow-ups to the above article and details not available to 99%+ investors? Sign up to our free newsletter today!
Author

Przemyslaw Radomski, CFA
Gold Price Forecast
Przemyslaw Radomski, CFA (PR) is a precious metals investor and analyst who takes advantage of the emotionality on the markets, and invites you to do the same. His company, Sunshine Profits, publishes analytical software that any