The Dollar surges as Gold slides; Could a turning point be near?

Well, today's markets certainly aren't following yesterday's script.
The dollar bulls have pushed through several important technical barriers, including resistance levels on the weekly chart that had previously kept buyers in check.
Meanwhile, gold is moving in the opposite direction, challenging the foundations of its recent bullish setup.
At first glance, the message seems straightforward: dollar bulls are gaining strength while gold bears are taking control.
But here's the interesting part.
The dollar is approaching an important resistance area on the monthly chart, while gold is testing a weekly support zone that could still play a crucial role in the next move.
Could the very moves that look so convincing today eventually set the stage for a reversal?
Let's take a closer look at the technical evidence.
U.S. Dollar (DX.F) - The bulls break through. But where could they stop?
Well, so much for the bears defending their territory.
After yesterday's failure to sustain the breakout above the orange consolidation, dollar bulls have returned with a vengeance. And this time, they've brought some serious technical arguments to the table.
Let's start with the daily chart.
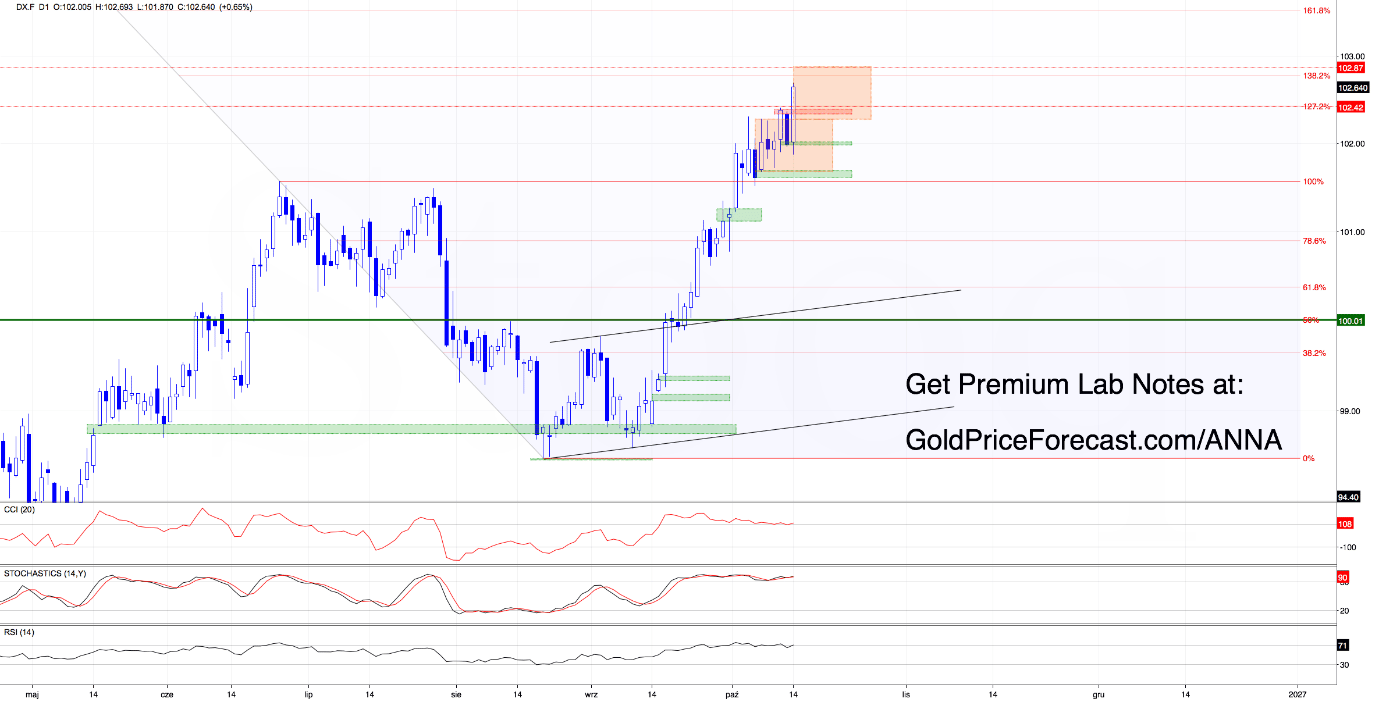
Buyers have pushed the dollar back above the upper boundary of the consolidation at 102.27 and recovered the area of yesterday's bearish gap at 102.33-102.37.
That's a meaningful development.
The breakout from the consolidation has strengthened the case for another upward move, with the minimum projected upside based on the formation's height pointing toward 102.87. And judging by today's price action, buyers aren't showing much hesitation.
But here's where things get considerably more interesting.
The weekly chart changes the perspective
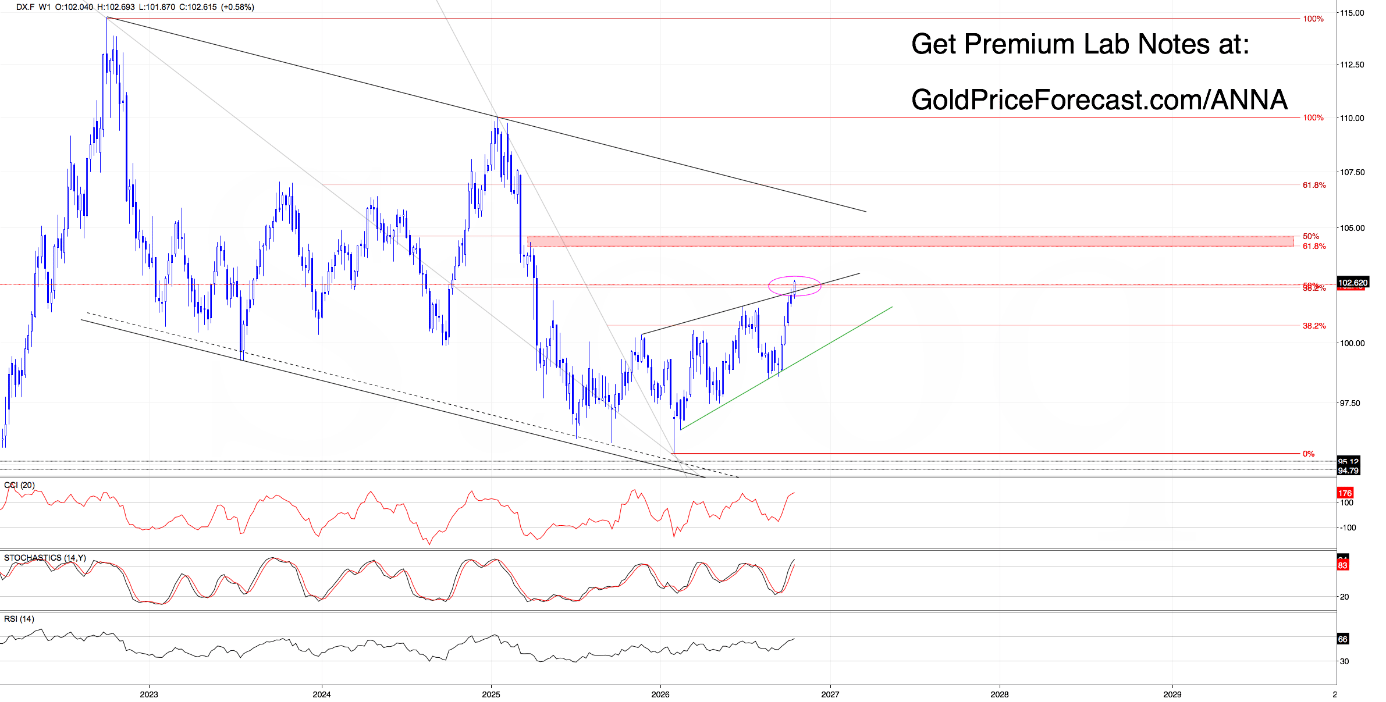
Remember the important resistance area that stopped the bulls earlier?
It wasn't just another horizontal barrier.
The zone around 102.36-102.49 brought together several technical obstacles, including Fibonacci levels, while the upper boundary of the wedge added another important challenge on the weekly chart.
And today?
Buyers have pushed through the wedge's upper boundary and the combination of the 38.2% and 50% Fibonacci retracements.
That's not something we can simply ignore.
Breaking through several important resistance barriers in one advance considerably strengthens the bullish argument and raises the possibility of a continuation toward the next Fibonacci resistance combination on the weekly chart.
What about the negative divergences visible on our indicators? They're still there and they still deserve attention. However, divergences are warnings, not automatic reversal signals. Right now, buyers are demonstrating that they're willing to challenge those warnings.
Nevertheless, there's another important detail on the weekly chart.
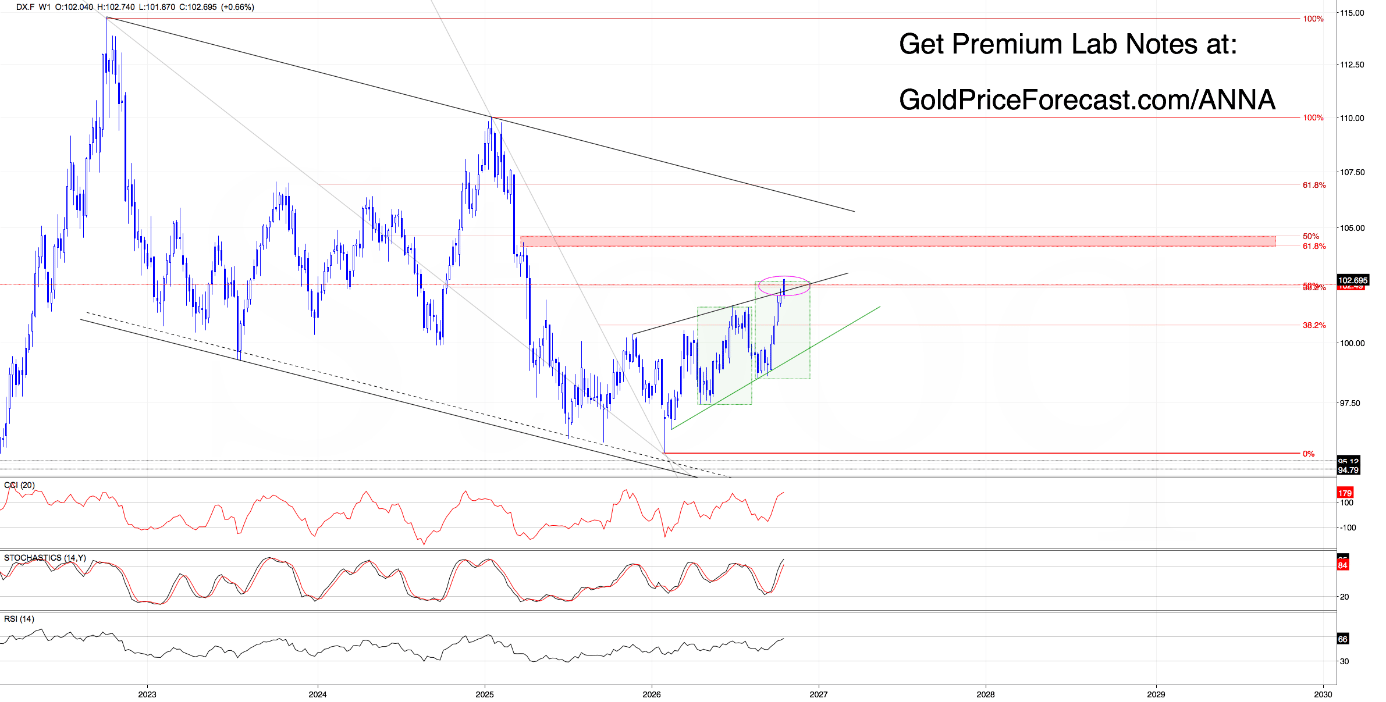
The dollar has already completed a measured upward move comparable in size to an earlier advance.
Does that mean the rally is over? Not necessarily, but it gives us a reason to consider whether the recent acceleration could eventually be followed by a corrective move. And that brings us to an even more interesting discovery.
Could 102.87-102.96 Become the Next Turning Point?
Take a look at the monthly chart.
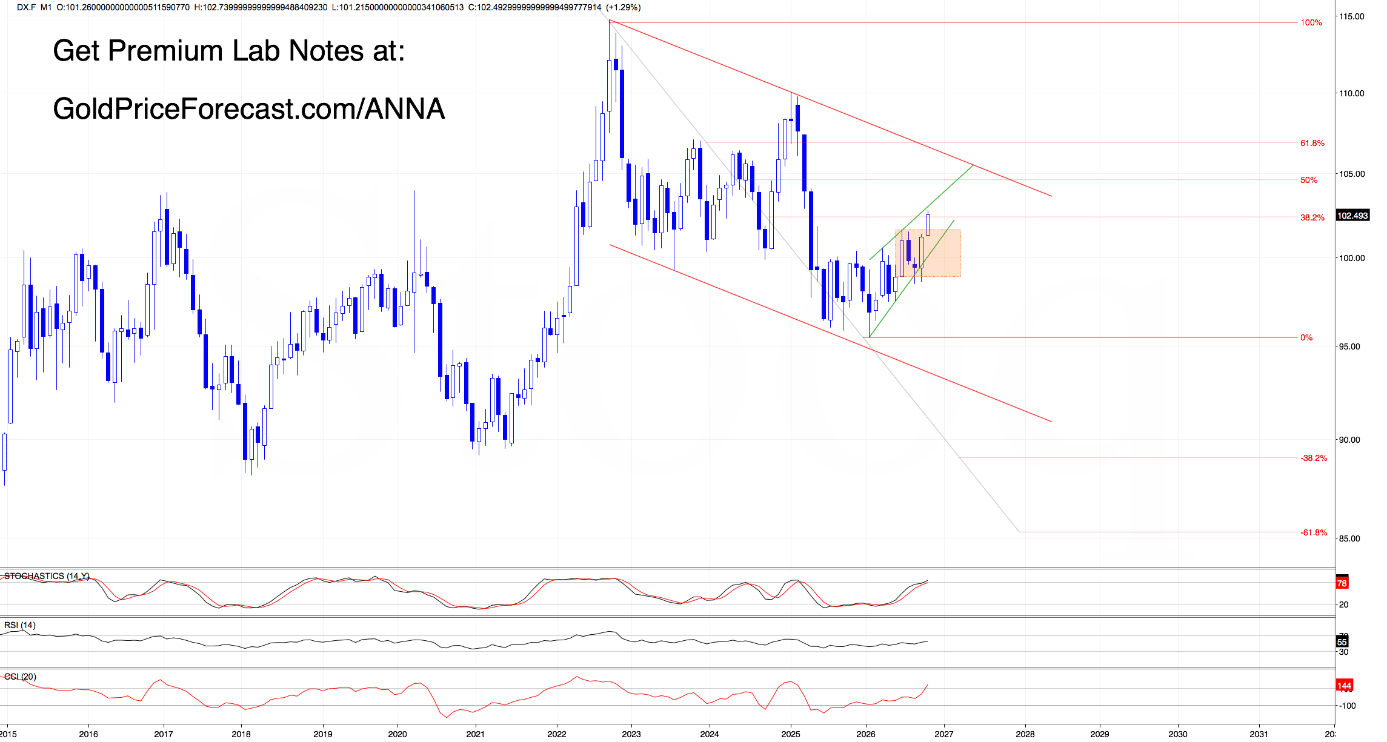
The dollar is approaching the upper boundary of a rising wedge, currently around 102.96.
Now compare that level with the minimum upside objective from the daily consolidation.
Daily projection: 102.87.
Monthly wedge resistance: 102.96.
Two different technical measurements, taken from different timeframes, point toward almost the same area.
That's an interesting combination and it raises a question worth asking:
What if another bullish push toward 102.87-102.96 eventually triggers a correction rather than an immediate continuation higher?
It's certainly a possibility we should keep in mind.
The dollar could complete its projected daily move, encounter resistance at the monthly wedge's upper boundary, and then retreat to verify previously broken resistance levels.
Such a development wouldn't automatically invalidate the broader bullish scenario. A successful retest could even provide the foundation for another advance, but a rejection followed by a sustained return below the broken resistance barriers would tell a considerably more cautious story.
On the other hand, if buyers successfully overcome the monthly wedge's upper boundary, the next combination of Fibonacci resistance levels on the weekly chart could become the next area of interest.
Daily Takeaway
• Bullish development: the dollar has pushed above the daily consolidation, recovered yesterday's bearish gap, and overcome important weekly resistance barriers.
• First upside objective: around 102.87, based on the height of the daily consolidation.
• Key resistance to watch: 102.87-102.96, where the daily projection approaches the monthly rising wedge's upper boundary.
• Potential warning: the weekly measured move has already been completed, while negative divergences remain visible.
• What could change the picture: a rejection followed by a sustained return below the broken resistance barriers would weaken the bullish case. A successful breakout above the monthly wedge could favor further gains.
Bottom line: buyers have delivered an impressive technical breakthrough, and the bullish scenario has gained considerable strength. But the closer the dollar gets to 102.87-102.96, the more important the market's reaction to that area could become.
The bulls have the momentum. Whether they can maintain it is the next question.
Gold (GC.F) - The bullish setup is under fire. But there's a twist
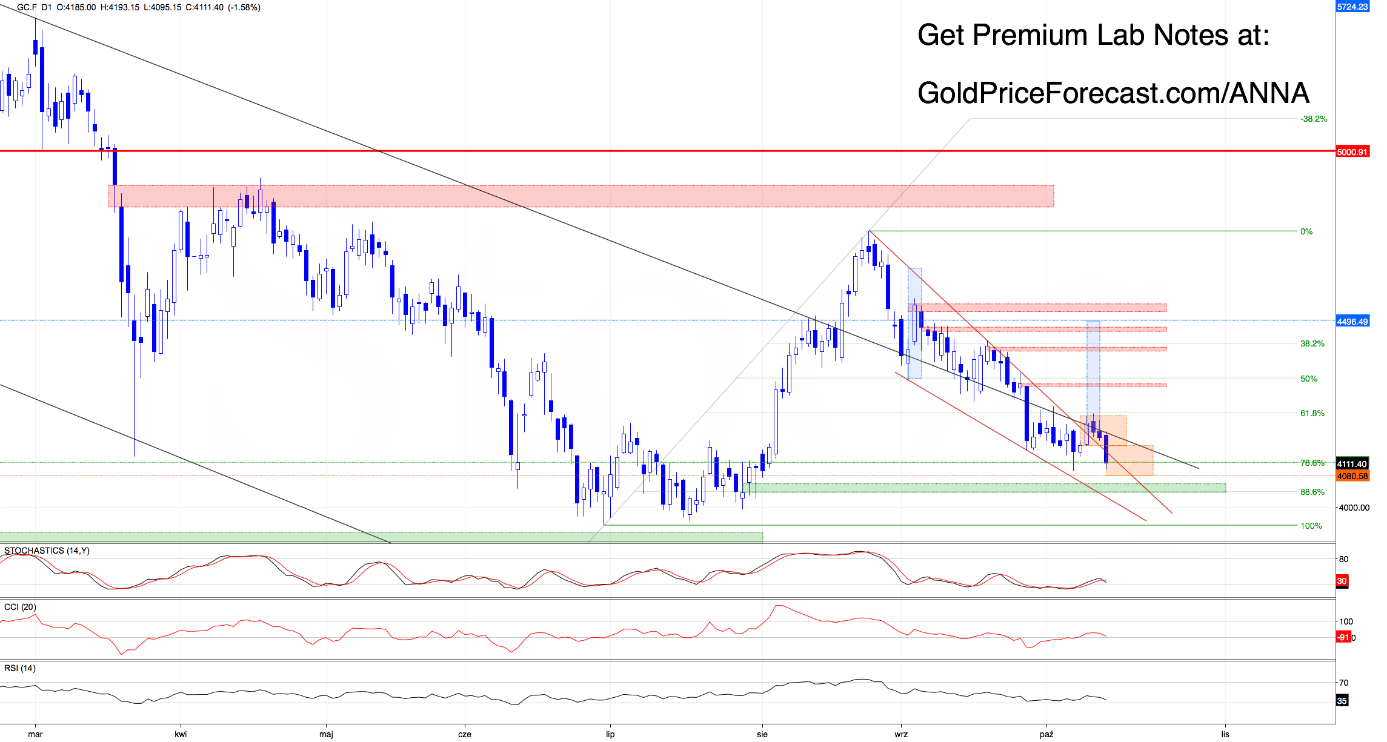
Well, gold bulls probably aren't enjoying today's session and we can't really blame them.
Yesterday, we highlighted 4156 as the level that could change the technical picture.
Why?
Because a daily close below it would not only invalidate the earlier breakout above the red falling wedge but also confirm a breakdown below the orange consolidation at 4156-4233.
Today's decline has pushed gold below that critical boundary. In other words, the bears are challenging exactly the conditions we identified as essential to the bullish scenario and that's a development we need to take seriously.
What does the daily breakdown suggest?
If sellers maintain their advantage and confirm the breakdown, the minimum projected move based on the height of the orange consolidation points toward 4080.
That's an important downside objective.
But getting there would have another consequence. Gold would move below last week's low at 4091, potentially creating a fresh low rather than the classic double-bottom formation we might otherwise expect.
And here's where the analysis becomes considerably more interesting.
The weekly chart tells another story
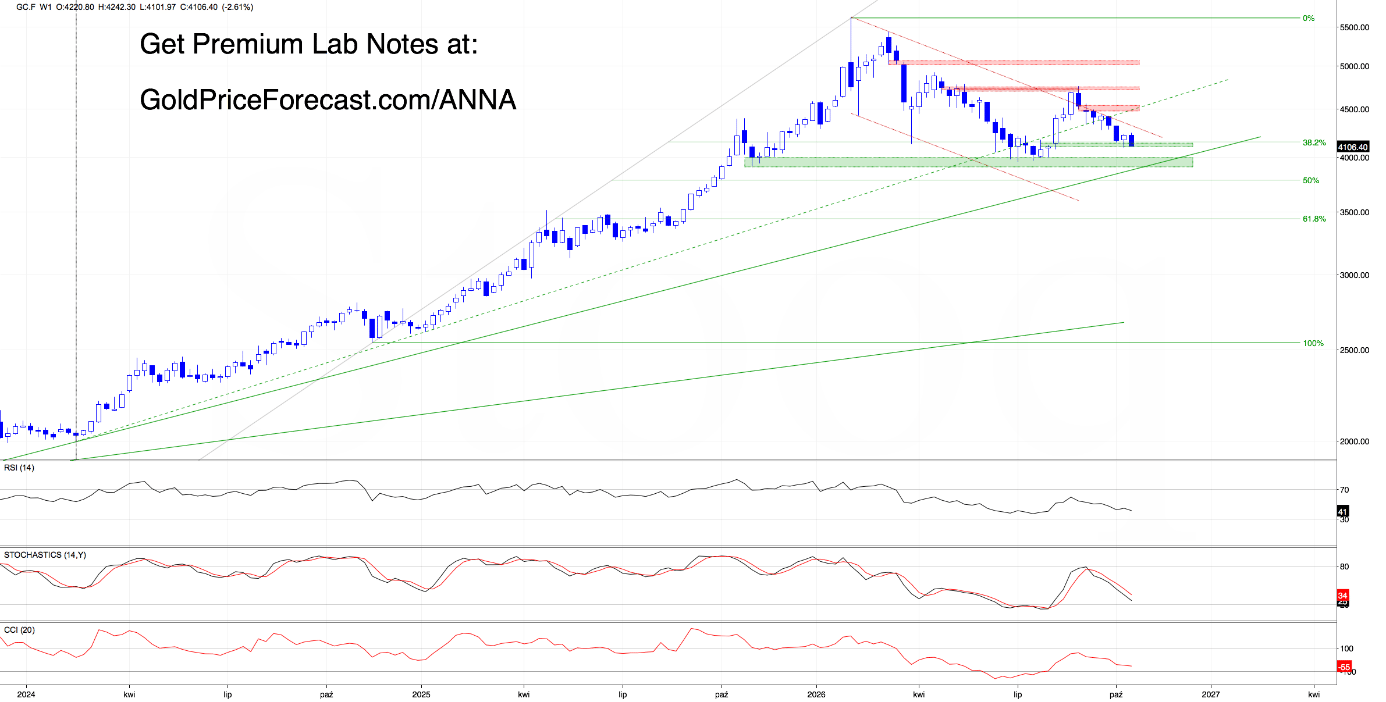
The weekly chart reveals an important bullish gap at 4098-4135.
This support area is now directly in the path of the developing decline, and it creates an intriguing technical situation.
What if the bears manage to push gold toward 4080, breaking below both the previous low at 4091 and the weekly gap's lower boundary at 4098? Would that automatically mean the bulls have lost the bigger battle? Not necessarily.
Sometimes the most important signal isn't the breakdown itself. It's what happens after it.
Let's imagine that sellers extend the decline, establish a fresh low, and then buyers step in aggressively enough to reclaim the weekly gap before Friday's close.
Under our weekly closing-confirmation approach, an intraweek move below 4098 would not, by itself, confirm a weekly breakdown of that support area.
And if gold were to finish the week back above 4135?
That would be particularly interesting.
Such price action could suggest that sellers failed to maintain control despite pushing the market below important support levels.
In other words, we could see a genuine bearish breakdown on the daily chart followed by an unsuccessful attempt to sustain that weakness on the weekly timeframe.
And that could provide the foundation for a corrective rebound.
But what if the bulls fail?
There's an important alternative.
If gold finishes the week below 4098, the breakdown below the entire weekly support area would receive confirmation under our methodology.
That would strengthen the bearish interpretation and leave the market vulnerable to additional downside pressure. And even if buyers manage to reclaim the gap, it wouldn't automatically restore the earlier bullish scenario.
The broken daily consolidation and the falling wedge would still need to be considered.
Daily Takeaway
• Bearish development: gold has fallen below 4156, challenging the recent bullish breakout and the orange consolidation.
• Conditional downside objective: around 4080, based on the height of the 4156-4233 consolidation.
• Critical weekly support: the bullish gap at 4098-4135, with the previous low at 4091 also in focus.
• Potential bullish response: an intraweek breakdown followed by a recovery above the weekly gap, particularly a weekly close above 4135, could suggest a failed attempt to sustain the decline.
• Bearish confirmation on the weekly chart: a weekly close below 4098 would strengthen the case for continued weakness.
Bottom line: today's decline has seriously challenged gold's bullish scenario. But the developing daily breakdown and the potential defense of weekly support are two different parts of the story.
The bears have made their move. Now let's see whether they can hold their ground.
And what about the rest of the metals market?
Gold isn't the only precious metal facing an important technical test.
Silver has slipped below major technical boundaries, platinum and palladium are approaching critical downside levels, and copper buyers have once again failed to overcome a familiar resistance area.
Final thought - Beyond the first move
Today, dollar bulls and gold bears have both made impressive moves, but stronger price action doesn't automatically make the next move predictable.
The dollar is approaching an area where resistance could become increasingly important. Gold, meanwhile, is testing support that may help determine whether its recent breakdown develops into something bigger.
Neither outcome is guaranteed and that's precisely why looking beyond the immediate price move matters. The market tells us what is happening. The technical roadmap helps us understand what to watch next.
Stay objective, follow the evidence, and keep an open mind.
Want free follow-ups to the above article and details not available to 99%+ investors? Sign up to our free newsletter today!
Author

Anna Radomska
Gold Price Forecast
Anna's passion for drawing evolved into a fascination with colorful lines and shapes, which later inspired her interest in the stock market.