Can the EUR Ride A Corrective Wave Higher in the Coming Weeks?
Key Points:
-
ABCD pattern beginning to shape up in the wake of the Elliot wave.
-
EMA bias suggesting a near-term shift in momentum set to occur.
-
Long-term trend still in play and likely to cap overall gains.
The recent uptick in buying pressure experienced by the EUR could be poised to extend into the next few weeks given some of the newly developing technical signals. Specifically, the presence of a corrective ABCD wave should be felt moving ahead, even if the long-term downtrend still looks to be firmly intact.
As demonstrated below, after only recently ending the fifth and final leg of its Elliot wave, the EUR seems to be enjoying a stint of increased popularity among traders. Typically, this would be indicative of some form of corrective wave taking hold of the pair which, in this case, will likely be the depicted ABCD wave. The primary reason that we expect to see such a wave take shape is due to just how well the forecastedretracements fit with some key support and resistance levels seen during the pair’s descent.
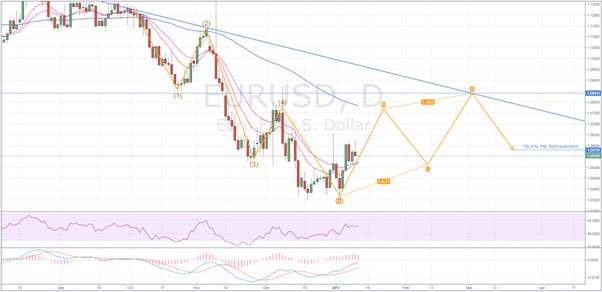
What’s more, a closer inspection of both the MACD oscillator and the EMA activity also suggests that we should continue to see some near-term upsides moving ahead. Specifically, the MACD is far from ready to have a signal line crossover which would generally indicate that buying pressure is fairly steady. Furthermore, the 12 and 20 day moving averages are on the cusp of experiencing a bullish crossover which would tend to confirm therecent change in momentum for the pair.
Despite the apparent shift in bias from bearish to bullish, gains will likely be capped around point B and almost certainly capped by point D. Starting with point B, a reversal would be expected here largely due to the presence of the 100 Day EMA which has proven to be a source of dynamic resistance during the Elliot wave phase of the EUR’s recent price action. As for point D, here the intersection of the long-term trend line, the 1.0841 zone of resistance, and the forecasted end point of the ABCD wave should present a rather formidable challenge to any continued bullish sentiment.
Ultimately, despite this near-term uptrend, the EUR should move back into decline and will potentially stumble back to around the 1.0575 mark after the corrective wave has completed. Whether the pair continues to track lower after moving back to this 78.6% Fibonacci retracement and seek out parity is still up for debate. However, if the aforementioned pattern does take place, there would be a strong case for a long-term Elliot or ABC wave which could certainly see parity reached moving ahead. As result, the EUR could be worth keeping an eye on for both the bears and the bulls out there.
Author

Matthew Ashley
Blackwell Global Investments Limited
Matthew joined Blackwell Global in March 2016; he works as a currency analyst in the research department based in Auckland.


