CAD/JPY solid support zone capped further losses

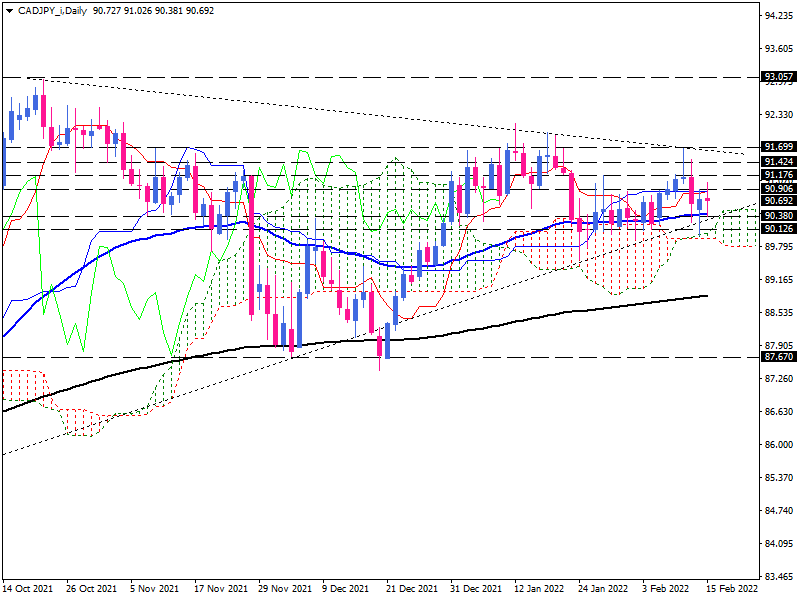
On the daily chart, the CAD/JPY pair continues to move slightly upward along with the 50-day moving average. The confluence of the moving average, the Kumo cloud and the triangle's support line have formed a strong support zone. And these long lower shadows demonstrate that buyers have vigorously defended this area. Considering the position of Kijun-Sen and Tenken-Sen, combined with the thin Kumo future after a bearish Kumo twist, indicates that the pair may not be ready for instant traction. If Tenken-Sen crosses Kijun-Sen upwards, it will signal an increase in buying forces, and positive fluctuations can be expected.
Moreover, the momentum indicators display a relative market balance, which means buyers are not strong enough to push prices higher quickly. The RSI is in the neutral zone, and the momentum is oscillating sideways, just below the 100 level. And the MACD bars, which are about the same height as the flattening signal line, indicate the relative parity of market forces after selling pressure diminished.
Short-term view
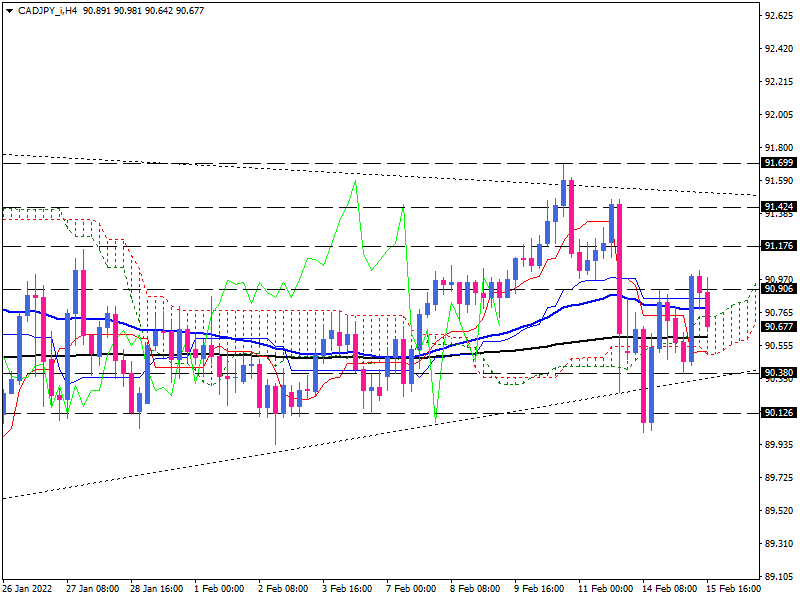
As we can see on the 4-hour chart, the 90.90 price ceiling is breaking with the influx of yen sellers. Should the price remain above this level, the next obstacle that could restrict the upward movement will be located at the level of 91,176. Once buyers overcome this roadblock, they will have to surpass the 91,424 mark before reaching the upper edge of the triangle. Otherwise, as the selling forces intensify, the Kumo cloud could attract buyers' attention as a potential support area. If this level is violated, the 90.380 price floor is expected to provide support. In the event of further declines, 90.126 may serve as the next support level.
Momentum oscillators suggest that the negative pressure is fading, but buyers are not yet strong enough to take the lead. The RSI is in the neutral zone around the 50-baseline, and momentum has moved up from its previous bottom but is still scouring the selling area. Additionally, the MACD bars are also below the zero level and the signal line, which does not support the bullish trend.
Author

Ali Mortazavi
Errante
BEc, CMSA, Member of IFTA - International Federation of Technical Analysis, Associate Member of STA - Society of Technical Analysis (UK).


