CAD/JPY has been bearish on the daily chart for the last three trading days. Yesterday’s daily candle came out as a bearish candle but it has a long lower spike. The H1 chart suggests that the price has a bounce at double bottom support and produces a bullish engulfing candle. If the price heads towards the North and makes a bullish breakout at a level of resistance, the buyers may go long on the pair and grab some green pips.
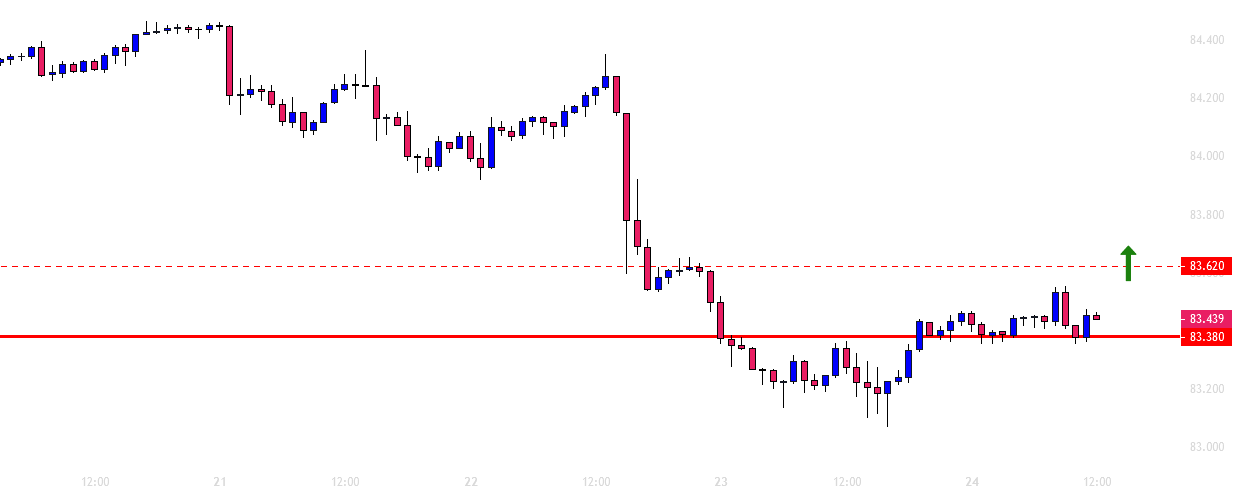
The chart shows that it made a bullish move earlier. It then came down at the same level and produced another bullish candle. If the price remains bullish and makes a breakout at the level of 83.620, the buyers may trigger a long entry.
Trade Summary
Entry: Buy above 83.620
Stop Loss: Below 83.380
Take Profit 1: 83.860
Take Profit 2: 83.980
Take Profit 3: 84.150
Risk Warning: CFD and Spot Forex trading both come with a high degree of risk. You must be prepared to sustain a total loss of any funds deposited with us, as well as any additional losses, charges, or other costs we incur in recovering any payment from you. Given the possibility of losing more than your entire investment, speculation in certain investments should only be conducted with risk capital funds that if lost will not significantly affect your personal or institution’s financial well-being. Before deciding to trade the products offered by us, you should carefully consider your objectives, financial situation, needs and level of experience. You should also be aware of all the risks associated with trading on margin.
Recommended Content
Editors’ Picks
AUD/USD could extend the recovery to 0.6500 and above
The enhanced risk appetite and the weakening of the Greenback enabled AUD/USD to build on the promising start to the week and trade closer to the key barrier at 0.6500 the figure ahead of key inflation figures in Australia.
EUR/USD now refocuses on the 200-day SMA
EUR/USD extended its positive momentum and rose above the 1.0700 yardstick, driven by the intense PMI-led retracement in the US Dollar as well as a prevailing risk-friendly environment in the FX universe.
Gold struggles around $2,325 despite broad US Dollar’s weakness
Gold reversed its direction and rose to the $2,320 area, erasing a large portion of its daily losses in the process. The benchmark 10-year US Treasury bond yield stays in the red below 4.6% following the weak US PMI data and supports XAU/USD.
Bitcoin price makes run for previous cycle highs as Morgan Stanley pushes BTC ETF exposure
Bitcoin (BTC) price strength continues to grow, three days after the fourth halving. Optimism continues to abound in the market as Bitcoiners envision a reclamation of previous cycle highs.
US versus the Eurozone: Inflation divergence causes monetary desynchronization
Historically there is a very close correlation between changes in US Treasury yields and German Bund yields. This is relevant at the current juncture, considering that the recent hawkish twist in the tone of the Federal Reserve might continue to push US long-term interest rates higher and put upward pressure on bond yields in the Eurozone.