|

CAD/JPY Breaks Above Long-Term Downside Resistance Line

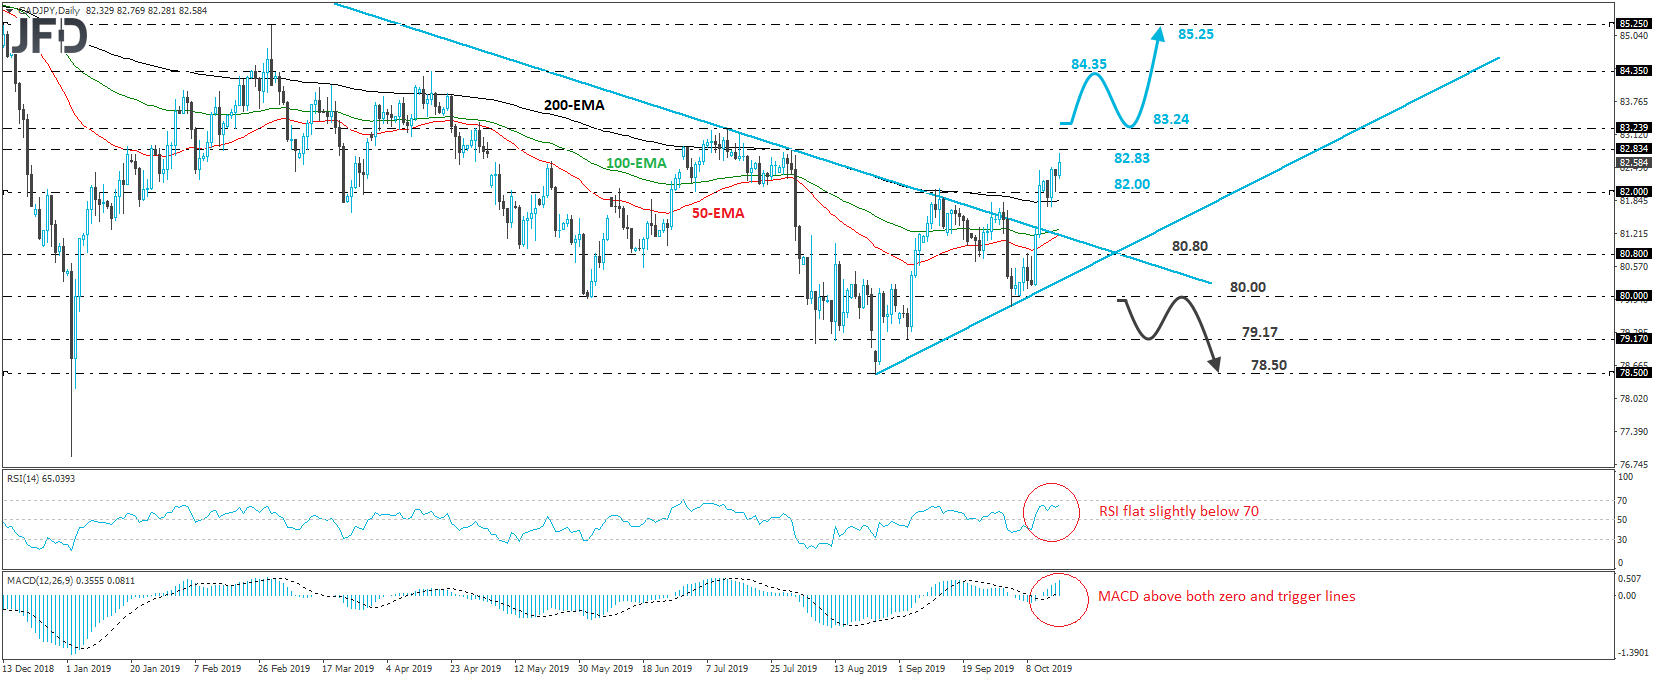
CAD/JPY surged last Friday, breaking above the long-term downside resistance line drawn from the high of October 3rd, last year. The rally continued this week as well, with the rate almost hitting the 82.83 zone, which is defined as a resistance by the high of July 31st. What’s more, the pair is also trading above a short-term upside line drawn from the low of August 28th, which combined with the aforementioned break above the long-term downside line paints a cautiously positive picture.

Having said all that though, we would like to wait for a strong break above 83.24 before we get confident on larger upside extensions. That barrier provided strong resistance back on May 1st, as well as on July 12th. Such a break is likely to trigger extensions towards the peak of April 17th, the break of which may allow the bulls to push towards the 85.25 zone, marked by the peak of March 1st.

Taking a look at our daily oscillators, we see that the RSI stands above 50, slightly below 70, while the MACD lies above both its zero and trigger lines. Both indicators detect positive momentum, but the fact that the RSI is moving sideways near its 70 barrier adds to our choice to wait for a clear break above 83.24 before we get confident on larger bullish extensions.

On the downside, we would like to see a decisive dip below the psychological number of 80.00 before we start examining whether the bears have gained back control. Such a dip is likely to initially aim for the low of September 3rd, at around 79.17, the break of which could extend the slide towards the low of August 25th, near 78.50.

CADJPY

JFDBANK.com - One-stop Multi-asset Experience for Trading and Investment Services


Author

More from JFD Team
Share:

Editor's Picks

EUR/USD hovers around nine-day EMA above 1.1800

EUR/USD remains in the positive territory after registering modest gains in the previous session, trading around 1.1820 during the Asian hours on Monday. The 14-day Relative Strength Index momentum indicator at 54 is edging higher, signaling improving momentum. RSI near mid-50s keeps momentum balanced. A sustained push above 60 would firm bullish control.

GBP/USD holds medium-term bullish bias above 1.3600

The GBP/USD pair trades on a softer note around 1.3605 during the early European session on Monday. Growing expectation of the Bank of England’s interest-rate cut weighs on the Pound Sterling against the Greenback. 

Gold sticks to gains above $5,000 as China's buying and Fed rate-cut bets drive demand

Gold surges past the $5,000 psychological mark during the Asian session on Monday in reaction to the weekend data, showing that the People's Bank of China extended its buying spree for a 15th month in January. Moreover, dovish US Federal Reserve expectations and concerns about the central bank's independence drag the US Dollar lower for the second straight day, providing an additional boost to the non-yielding yellow metal. 

Bitcoin, Ethereum and Ripple consolidate after massive sell-off

Bitcoin, Ethereum, and Ripple prices consolidated on Monday after correcting by nearly 9%, 8%, and 10% in the previous week, respectively. BTC is hovering around $70,000, while ETH and XRP are facing rejection at key levels.

Weekly column: Saturn-Neptune and the end of the Dollar’s 15-year bull cycle

Tariffs are not only inflationary for a nation but also risk undermining the trust and credibility that go hand in hand with the responsibility of being the leading nation in the free world and controlling the world’s reserve currency.

Bitcoin, Ethereum and Ripple consolidate after massive sell-off

Bitcoin, Ethereum, and Ripple prices consolidated on Monday after correcting by nearly 9%, 8%, and 10% in the previous week, respectively. BTC is hovering around $70,000, while ETH and XRP are facing rejection at key levels. Traders should be cautious: despite recent stabilization, upside recovery for these top three cryptocurrencies is capped as the broader trend remains bearish.