CAD/JPY - A Small Move Down

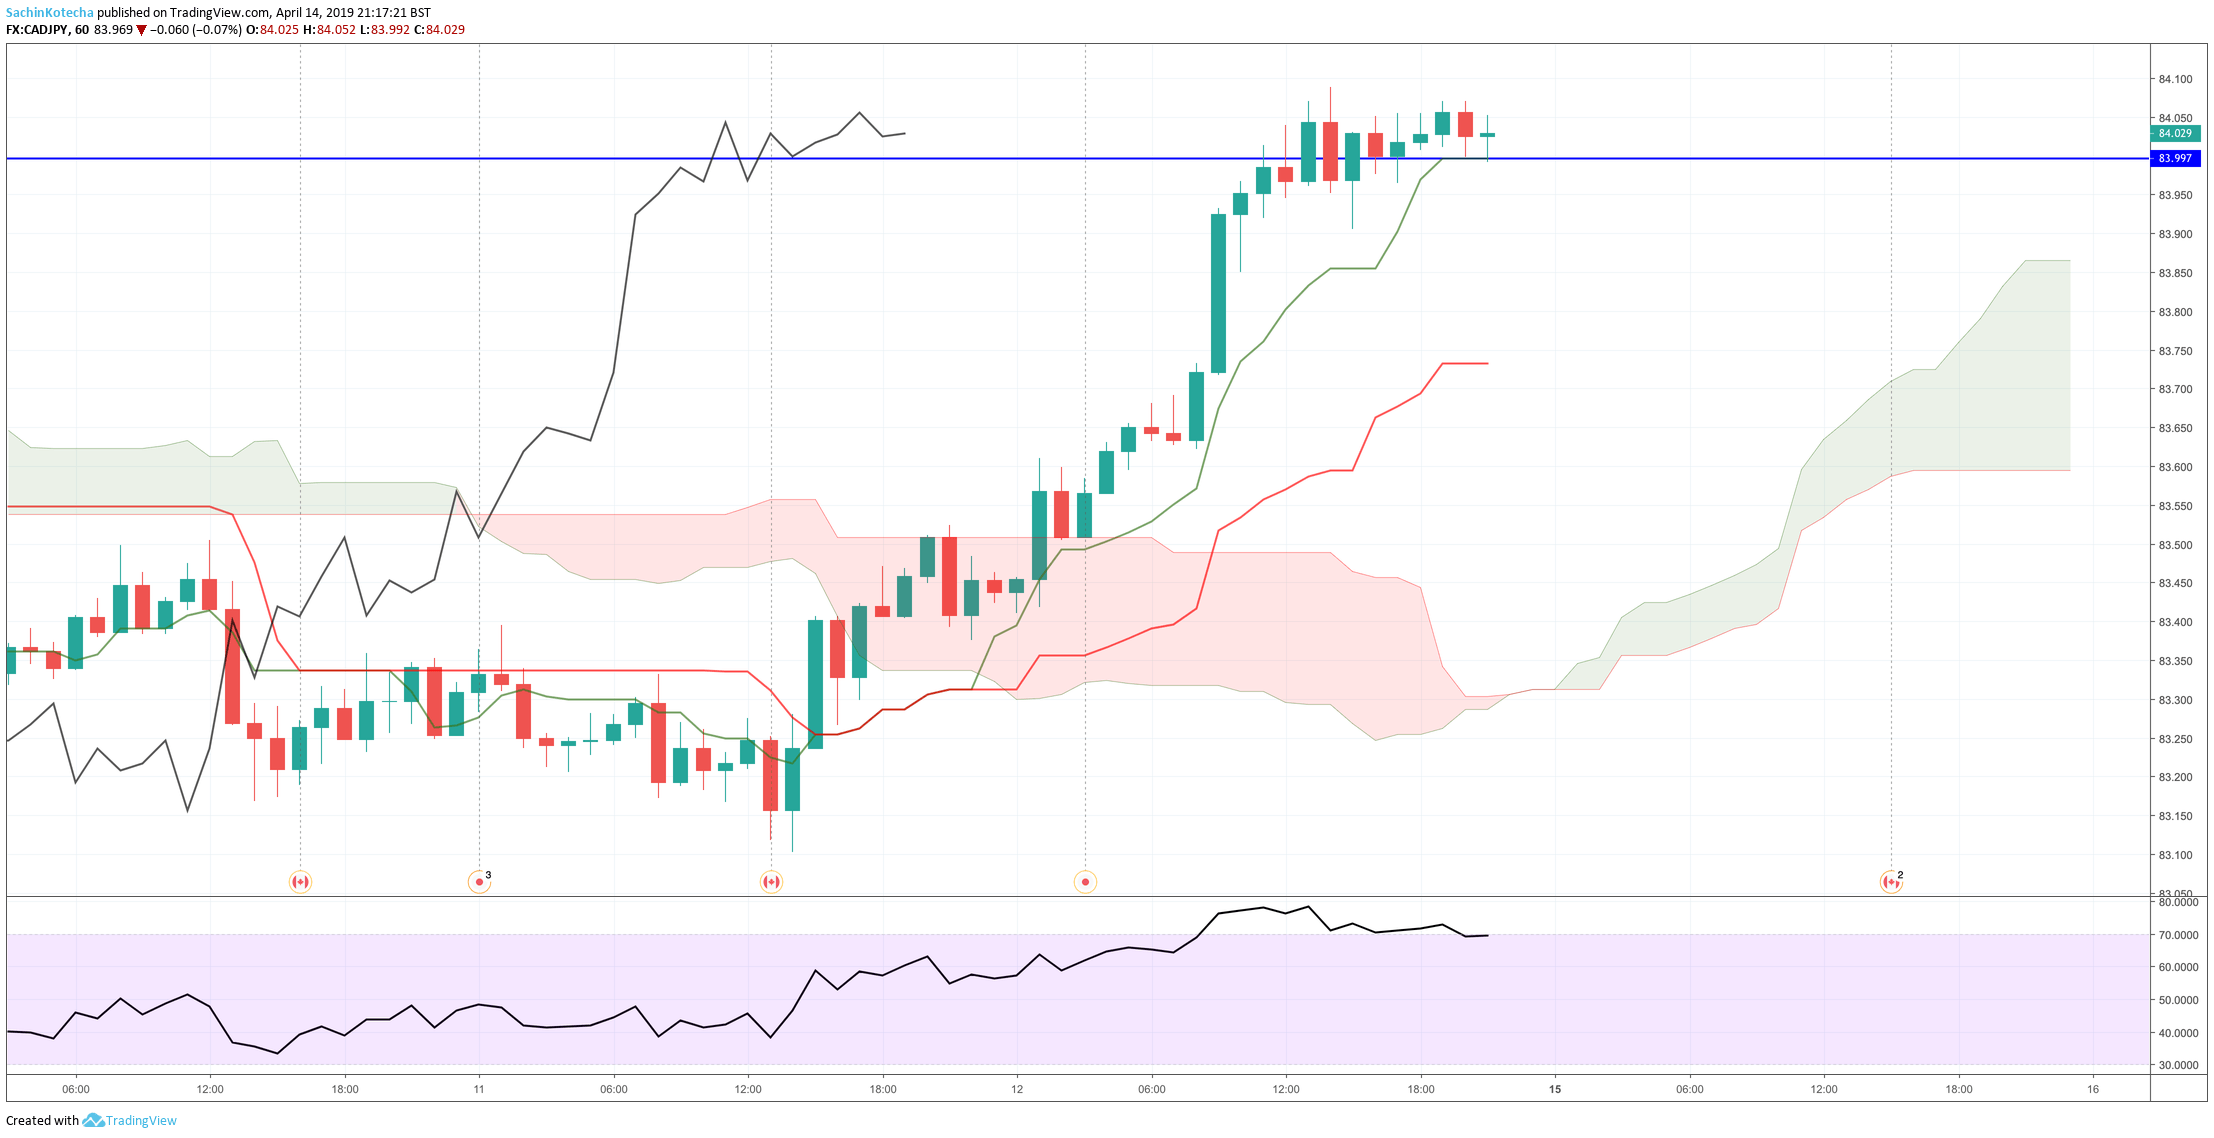
If we look at the 1-hour chart of CADJPY, we can see that the RSI is indicating to us that the currency pair is overbought, and that price has started to range over the previous 11 candles. All Ichimoku components are flat showing no directional bias, so we are like to see price range further, providing Tenkan Sen acts as support. If price breaks through Tenkan Sen we are likely to see price move down toward Kijun Sen, a downward movement of about 30 pips. If price fails to find support at Kijun Sen, then we could see a much bigger move towards Senkou Span A.
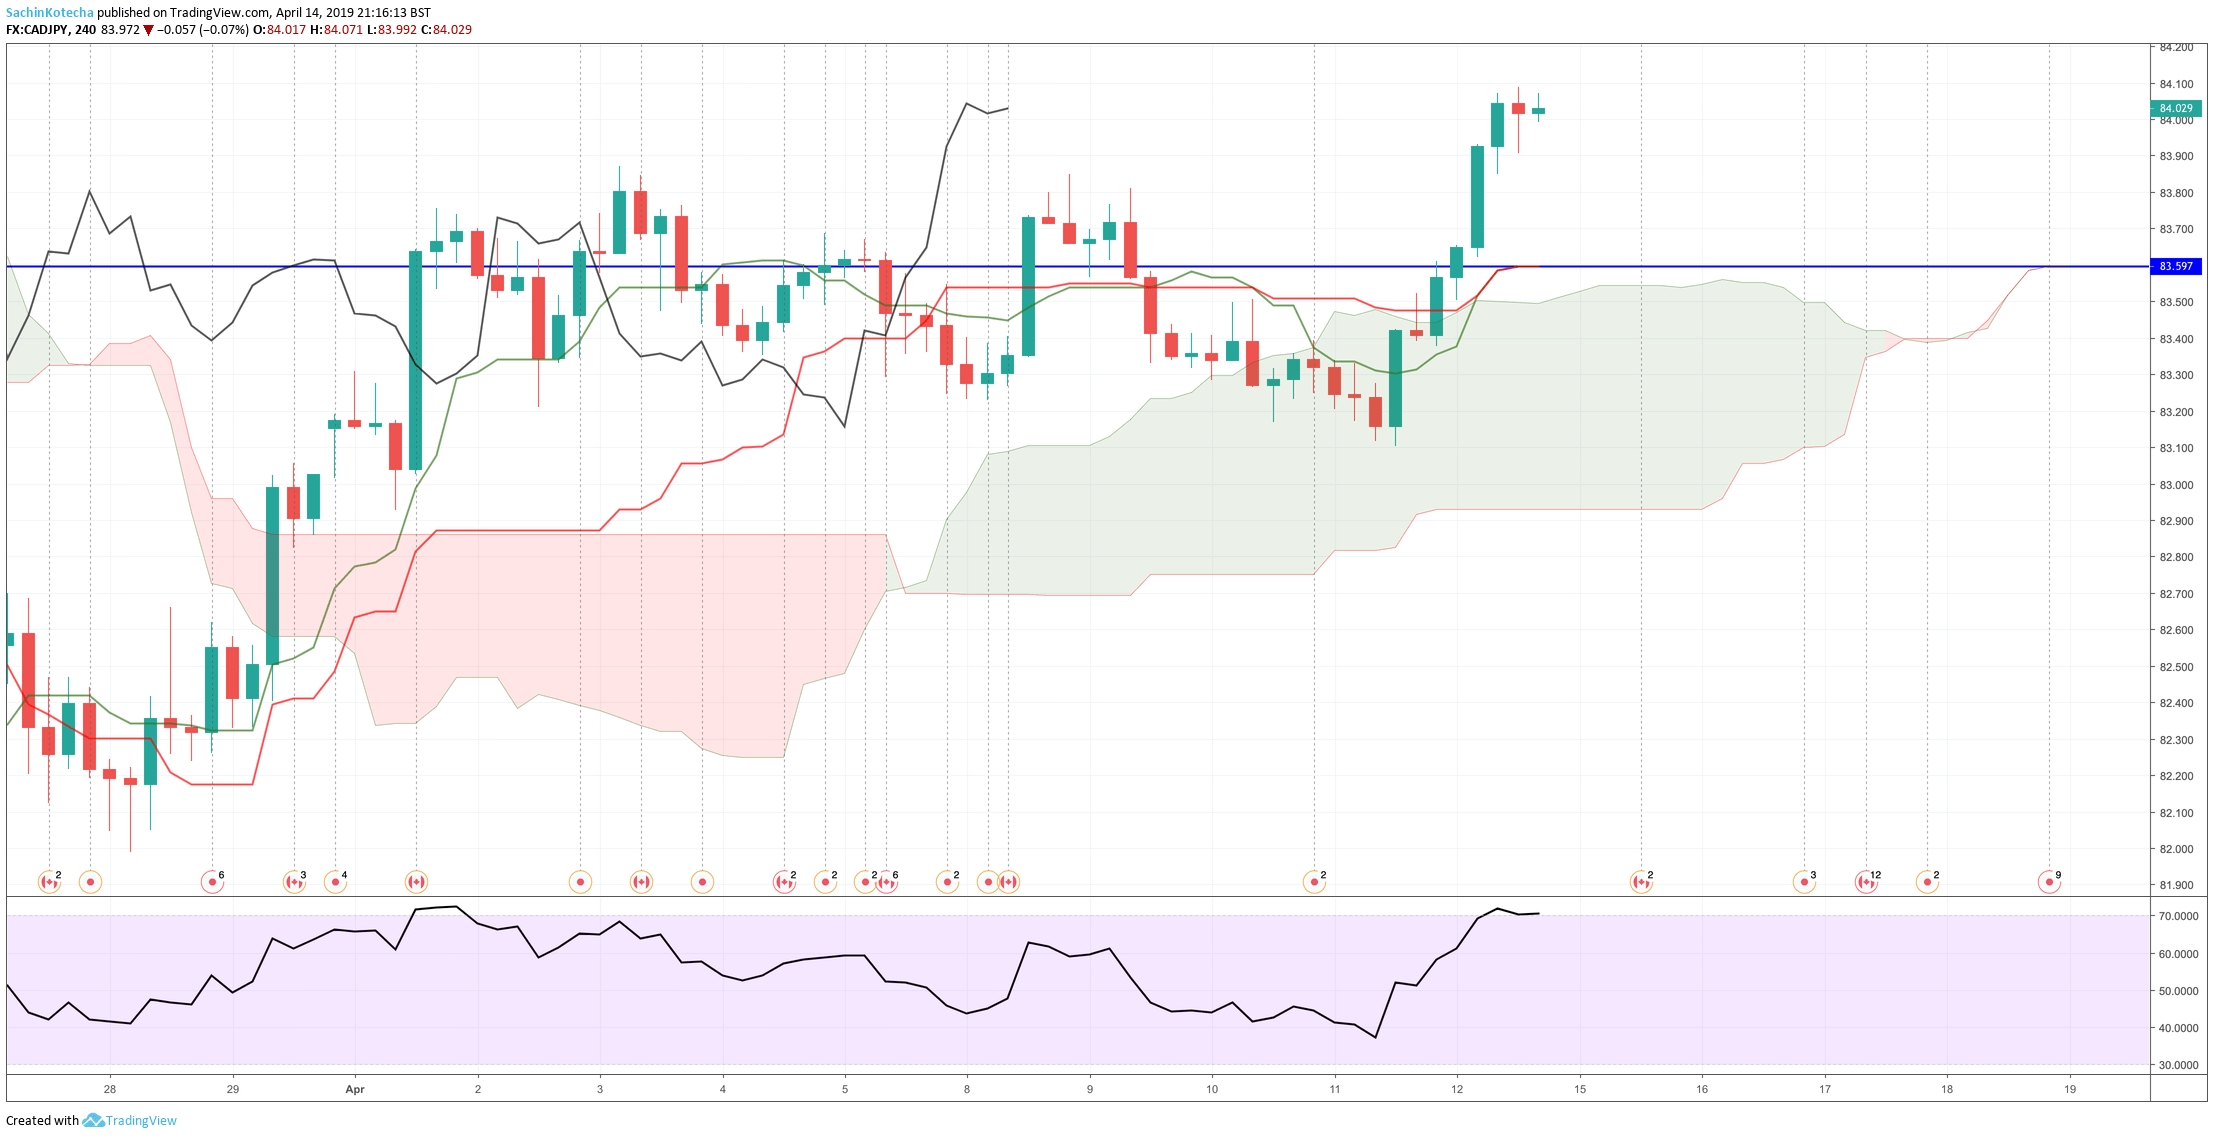
Looking at the 4-hour chart we can see that the price is about 50 pips away from both Sens. Tenkan Sen and Kijun Sen are both flat and aligned at price level 83.595 suggesting strong resistance at this level, Senkou Span A is also within 10 pips of both Sens at price level 83.500, further adding to the strength of the resistance at this area.
Author

Sachin Kotecha
Sach Capital Limited
Sachin Kotecha started currency trading in 2005 whilst at University studying Mechanical Engineering. Sachin continued trading whilst going on to do a Master/PhD in Engineering and trading part time whilst being employed as a University Academic.


