CAD/CHF sellers attempt to form a double-top
CADCHF price action on the 4-hour chart has depicted a bearish set-up since the sellers broke below the short-term support at the 0.7308 mark.
The CADCHF is attempting to find a clear direction after the uptrend paused, with buyers retreating from the 0.7362 peaks. The break of 0.7308 support has pushed the pair below the 50 EMA in the morning trading on Friday.
With more selling pressure emerging, a decisive break of the 0.7270 barriers would evidence a bearish double-top pattern that would encourage technical sellers to jump into the market. In this scenario, the next support area could appear at the 0.7254 level, which lines up with the 200 EMA.
In the event that the CADCHF falls further, sellers will be looking toward the next area of support at 0.7221.
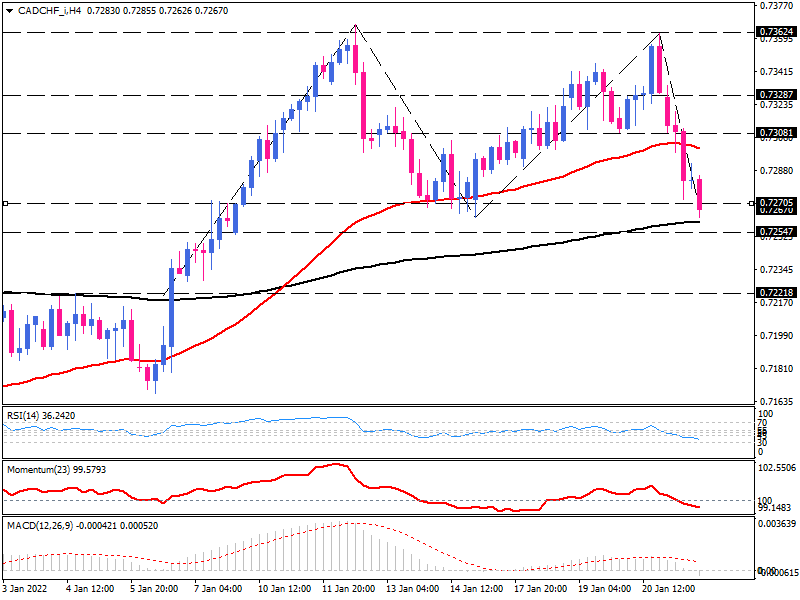
Otherwise, should buyers keep the ground above the 0.7270 handles, they would have a chance to meet the 50 EMA.
Clearing this obstacle around 0.7308 might pave the way towards the 0.7328 previous level of interest.
Nevertheless, it is imperative to remember that the continuation of the uptrend requires overcoming the two-month price ceiling at 0.7362.
Short-term momentum oscillators indicate a prevailing bearish sentiment. The RSI is hovering below the 50-baseline, and the Momentum is pulling down below the 100-threshold in the selling area.
And The MACD bar is about to cross the zero line into the negative zone.
Author

Ali Mortazavi
Errante
BEc, CMSA, Member of IFTA - International Federation of Technical Analysis, Associate Member of STA - Society of Technical Analysis (UK).


