CAC40 – Bullish Minor 5 – Triple Three Pattern
CAC40 is technically looking ‘’interesting’’.
I know a nice Structure when I see one and I personally believe that it could possibly end Aug and enter Sep with a Rally.
The all-time charts take us back to 1987 since when the Bullish (ABC) Super-Cycle began.
CAC40 – Monthly Chart (picture):
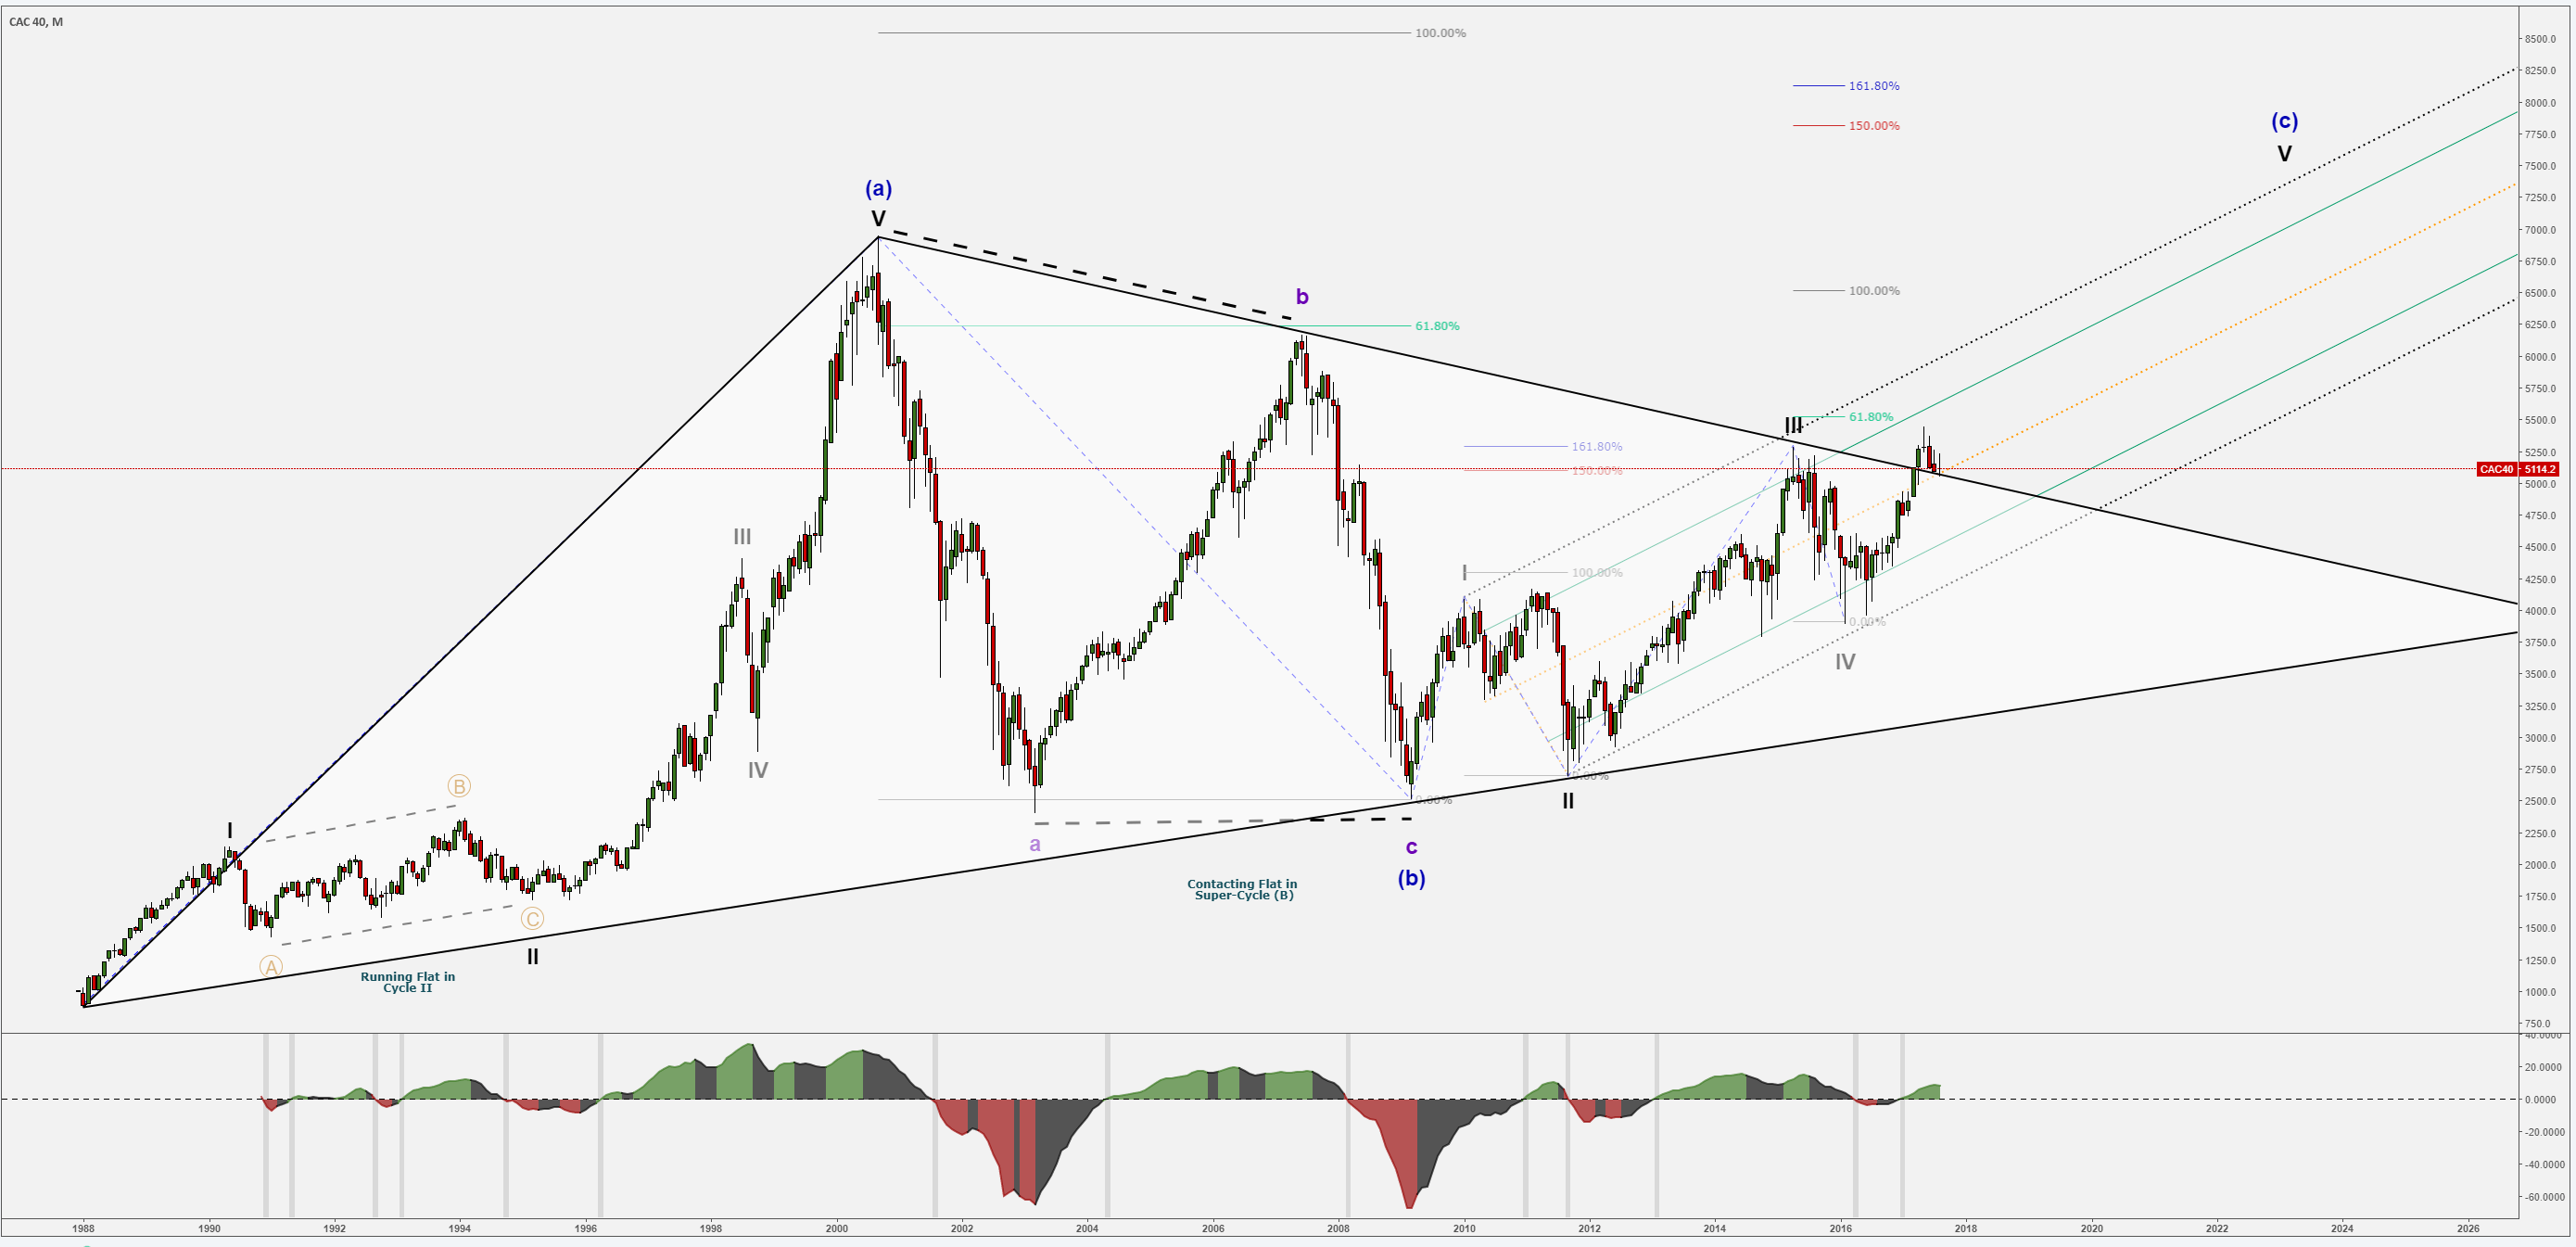
Monthly Chart – Wave Analysis:
- Super-Cycle Wave (a) (blue) unfolded with a 5 Wave Sequence in its lower degrees Cycle Waves (black), with a Running Flat Correction in Cycle Wave II (black) and a Sharp Zig-Zag in Cycle Wave IV (black), which fits nicely the “Law of Alternation”.
The fact that Super-Cycle Wave (a) (blue) unfolded with 5 Wave Sequence on the up-side indicates the fact that Super-Cycle Wave (c) (blue) would also present a 5 Waves Sequence in its Structure, making the overall bigger picture a classic Zig-Zag. - Super-Cycle Wave (b) (blue) unfolded as a Contracting Flat Structure in its lower degrees Cycle Waves (abc) (purple), giving us a Continuation Pattern under the form of a Triangle, which kept it from moving to higher grounds.
- Super-Cycle Wave (c) (blue) presents a Rising Channel in its lower degrees Cycle Waves (black) and we can clearly see the ‘’get out of jail’’ card which recently took place, making CAC40 free to stretch its wings and move towards higher horizons.
Critics would say that Cycle Wave IV (black) enters the Price Territory of Cycle Wave I (black) and that should invalidate the Wave Count, BUT! We are trading within a Rising Channel and this would bend that rule, hence the reason why we applied a Pitchfork.
CAC40 – Weekly Chart (picture):
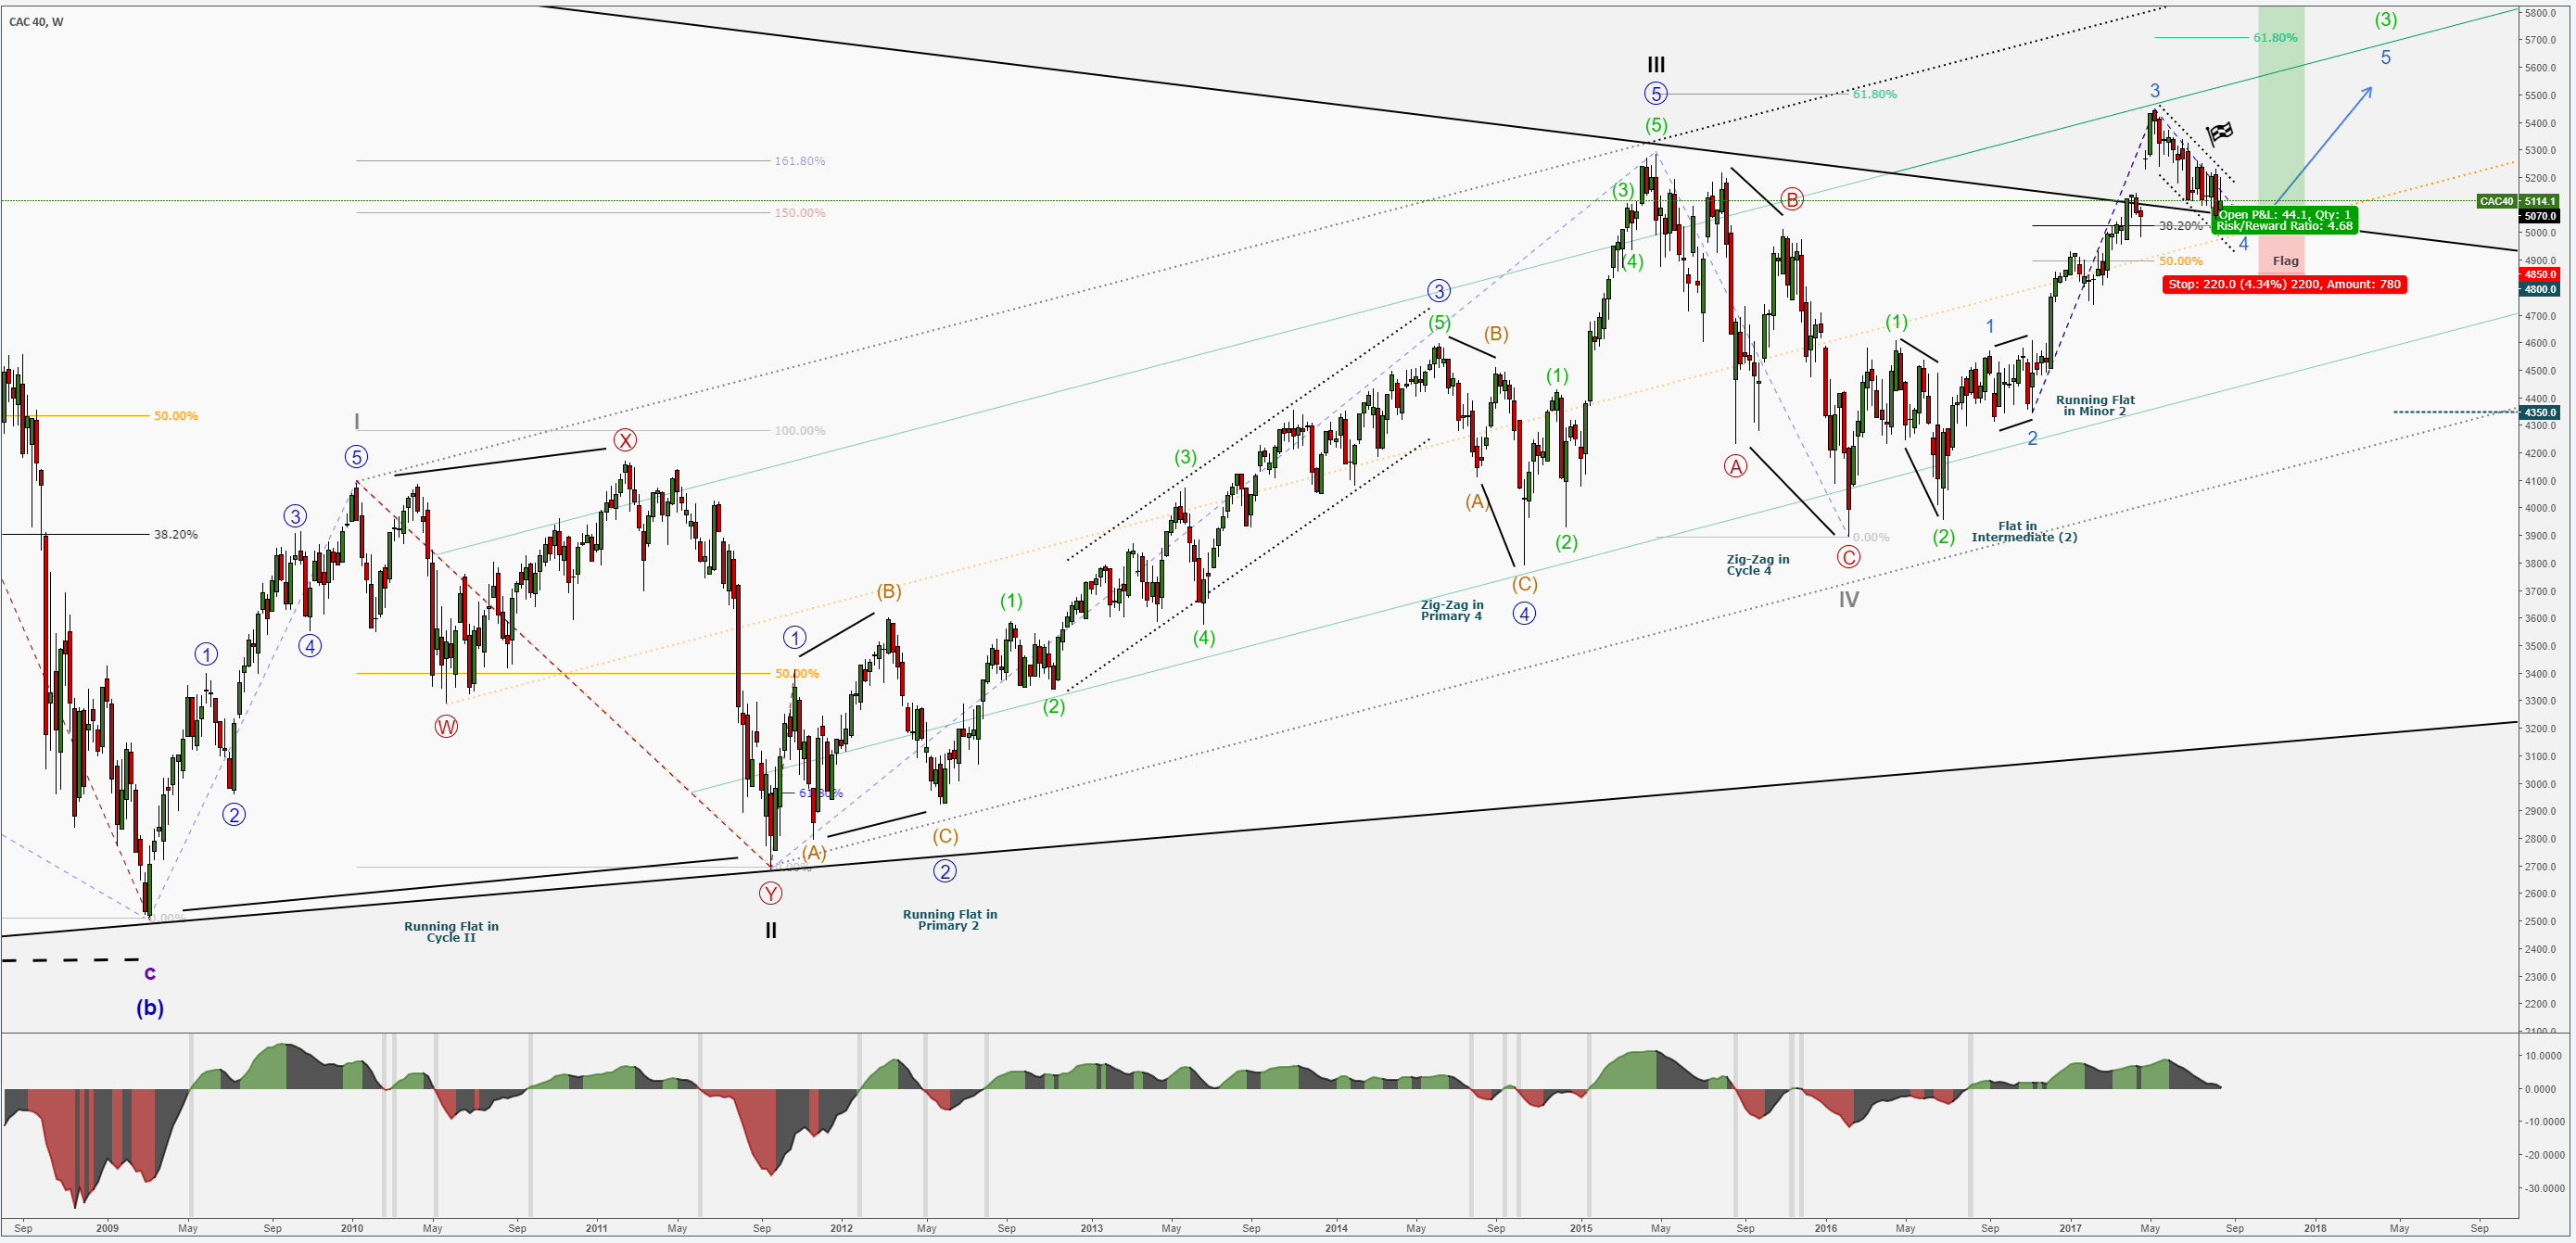
Weekly Chart – Cycle Wave (c) – Wave Analysis:
- Cycle Wave I (black) unfolded with a 5 Swings Sequence in its Primary (blue) sub-waves, hitting a 38.2% Fibonacci Retracement of Cycle Wave C (purple).
- Cycle Wave II (black) unfolded as a Complex Double Three Structure, within a Running Flat Structure, and retracing almost the entire gain that Cycle Wave I (black) had, just to retest the lower Trend-Line of the Super-Cycle Triangle and then bouncing off to future highs.
- Cycle Wave III (black):
- Primary 1 (blue) hit the 50% Fibonacci Retracement of Cycle Wave II (black) with an unnoticed ‘’bell’’ that the Market was reversing, due to the fact that at this stage, the Market was still ‘’cautious’’.
- Primary 2 (blue) reversed with its Intermediate (ABC) (orange) legs, within a Running Flat Structure, in an attempt for the Market to continue the down-trend but failing to breach the 61.8% Fibonacci Retracements of Primary 1 (blue).
- Primary 3 (blue) presents a classic Extension caused by its Intermediate sub-waves (green) and unfolding within a Rising Channel.
- Primary 4 (blue) retraced sharply as per the (ABC) Zig-Zag Intermediate Correction, due to the Running Flat in Primary 2 (blue), making an appeal to the Law of Alternation.
- Primary 5 (blue) continued the optimism with a strong Rally in its Intermediate (green) Impulse Structure, only to find its Resistance at the upper Triangle Trend-Line.
- Cycle Wave IV (black) called in reinforcements, the Law of Alternation. Due to the Complex Structure in Cycle Wave II (black), Cycle Wave IV (black) drilled sharply and aggressively with its ABC Primary Waves (red).
- Cycle Wave V (black) is unfolding presently.
Let’s zoom in!
CAC40 – Daily Chart (picture):
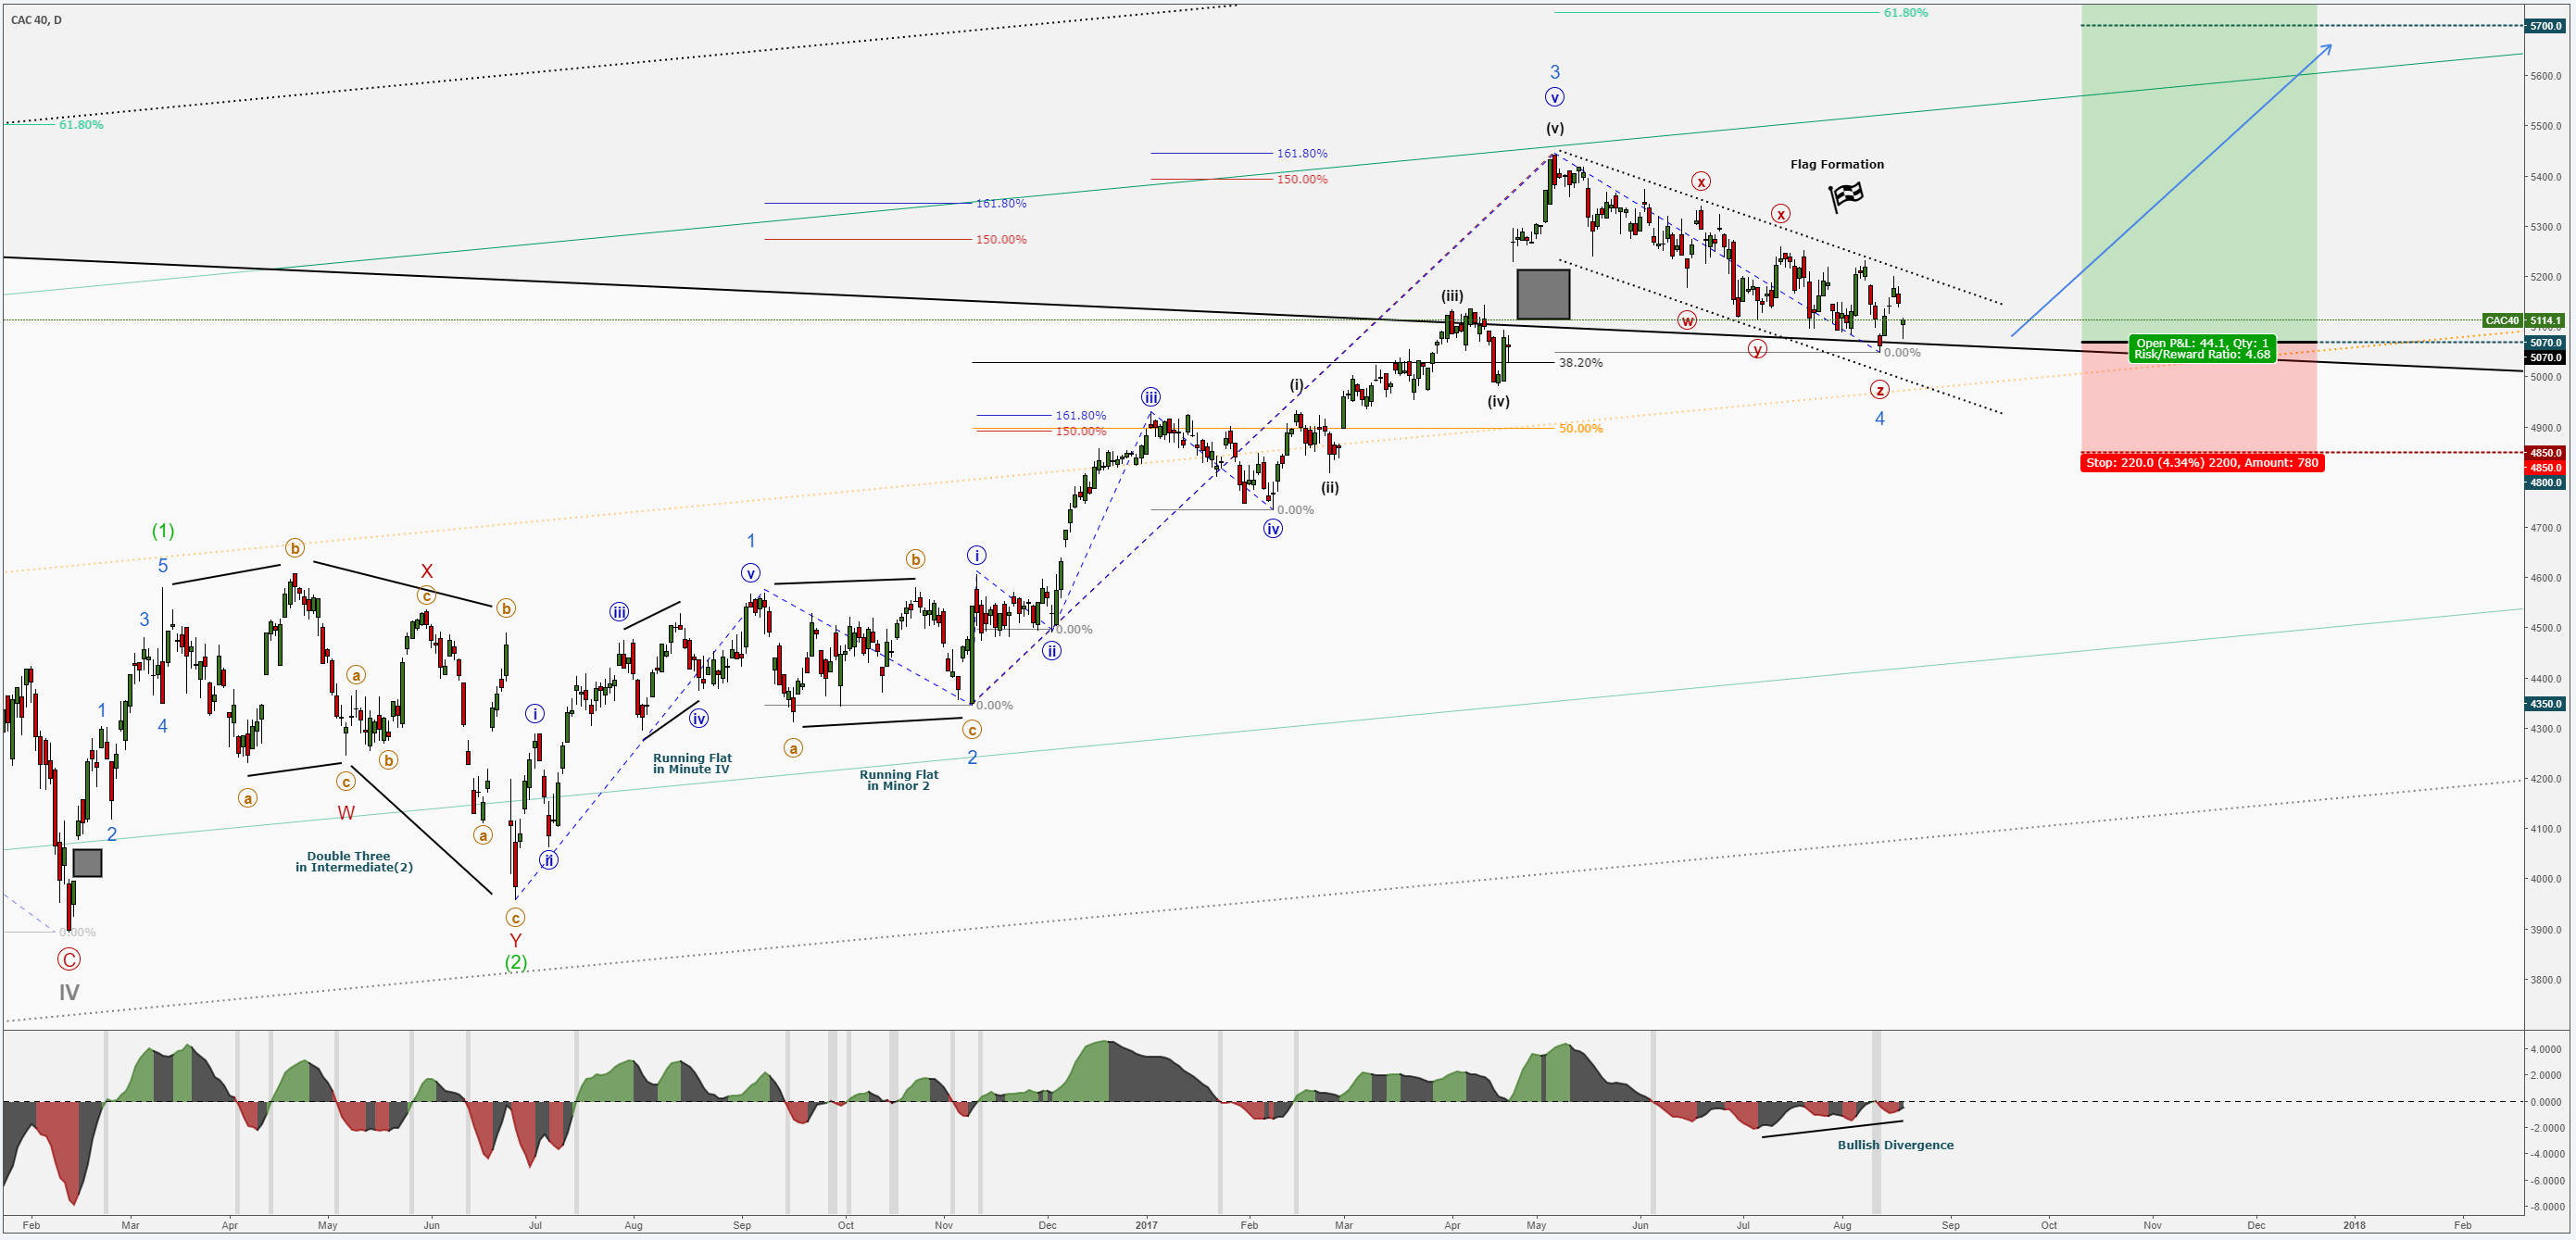
- Intermediate (1) (green) started pushing on the up-side with a 5 Swings Sequence, leaving a gap behind (later to be filled).
- Intermediate (2) (green) unfolded with a Complex Double Three WXY (red) Structure filling the gap and leaving room for the Bullish Trend.
- Intermediate (3) (green) is still unfolding its structure, with Minor 4 (light blue) about to complete and leaving room for a Bullish run in Minor 5 (light blue).
Minor 1 (light blue) presents a 5 Swings Sequence, with a sharp Correction Zig-Zag in Minute ii (blue) and a Running Flat in Minute iv (blue).
Minor 2 (light blue) unfolded as a Running Flat in its Minute (orange) sub-waves.
Minor 3 (light blue) presents a 161.8% Fibonacci Extension of Minors 1 & 2 (light blue). It is also the strongest Rally, reaching 161.8% Fibonacci Extensions on all degrees. - Minor 4 (light blue) is in focus and about to complete, as it is touching the upper Triangle Trend-Line and forming a Flag.
Let’s get closer!
CAC40 – 4H Chart (picture):
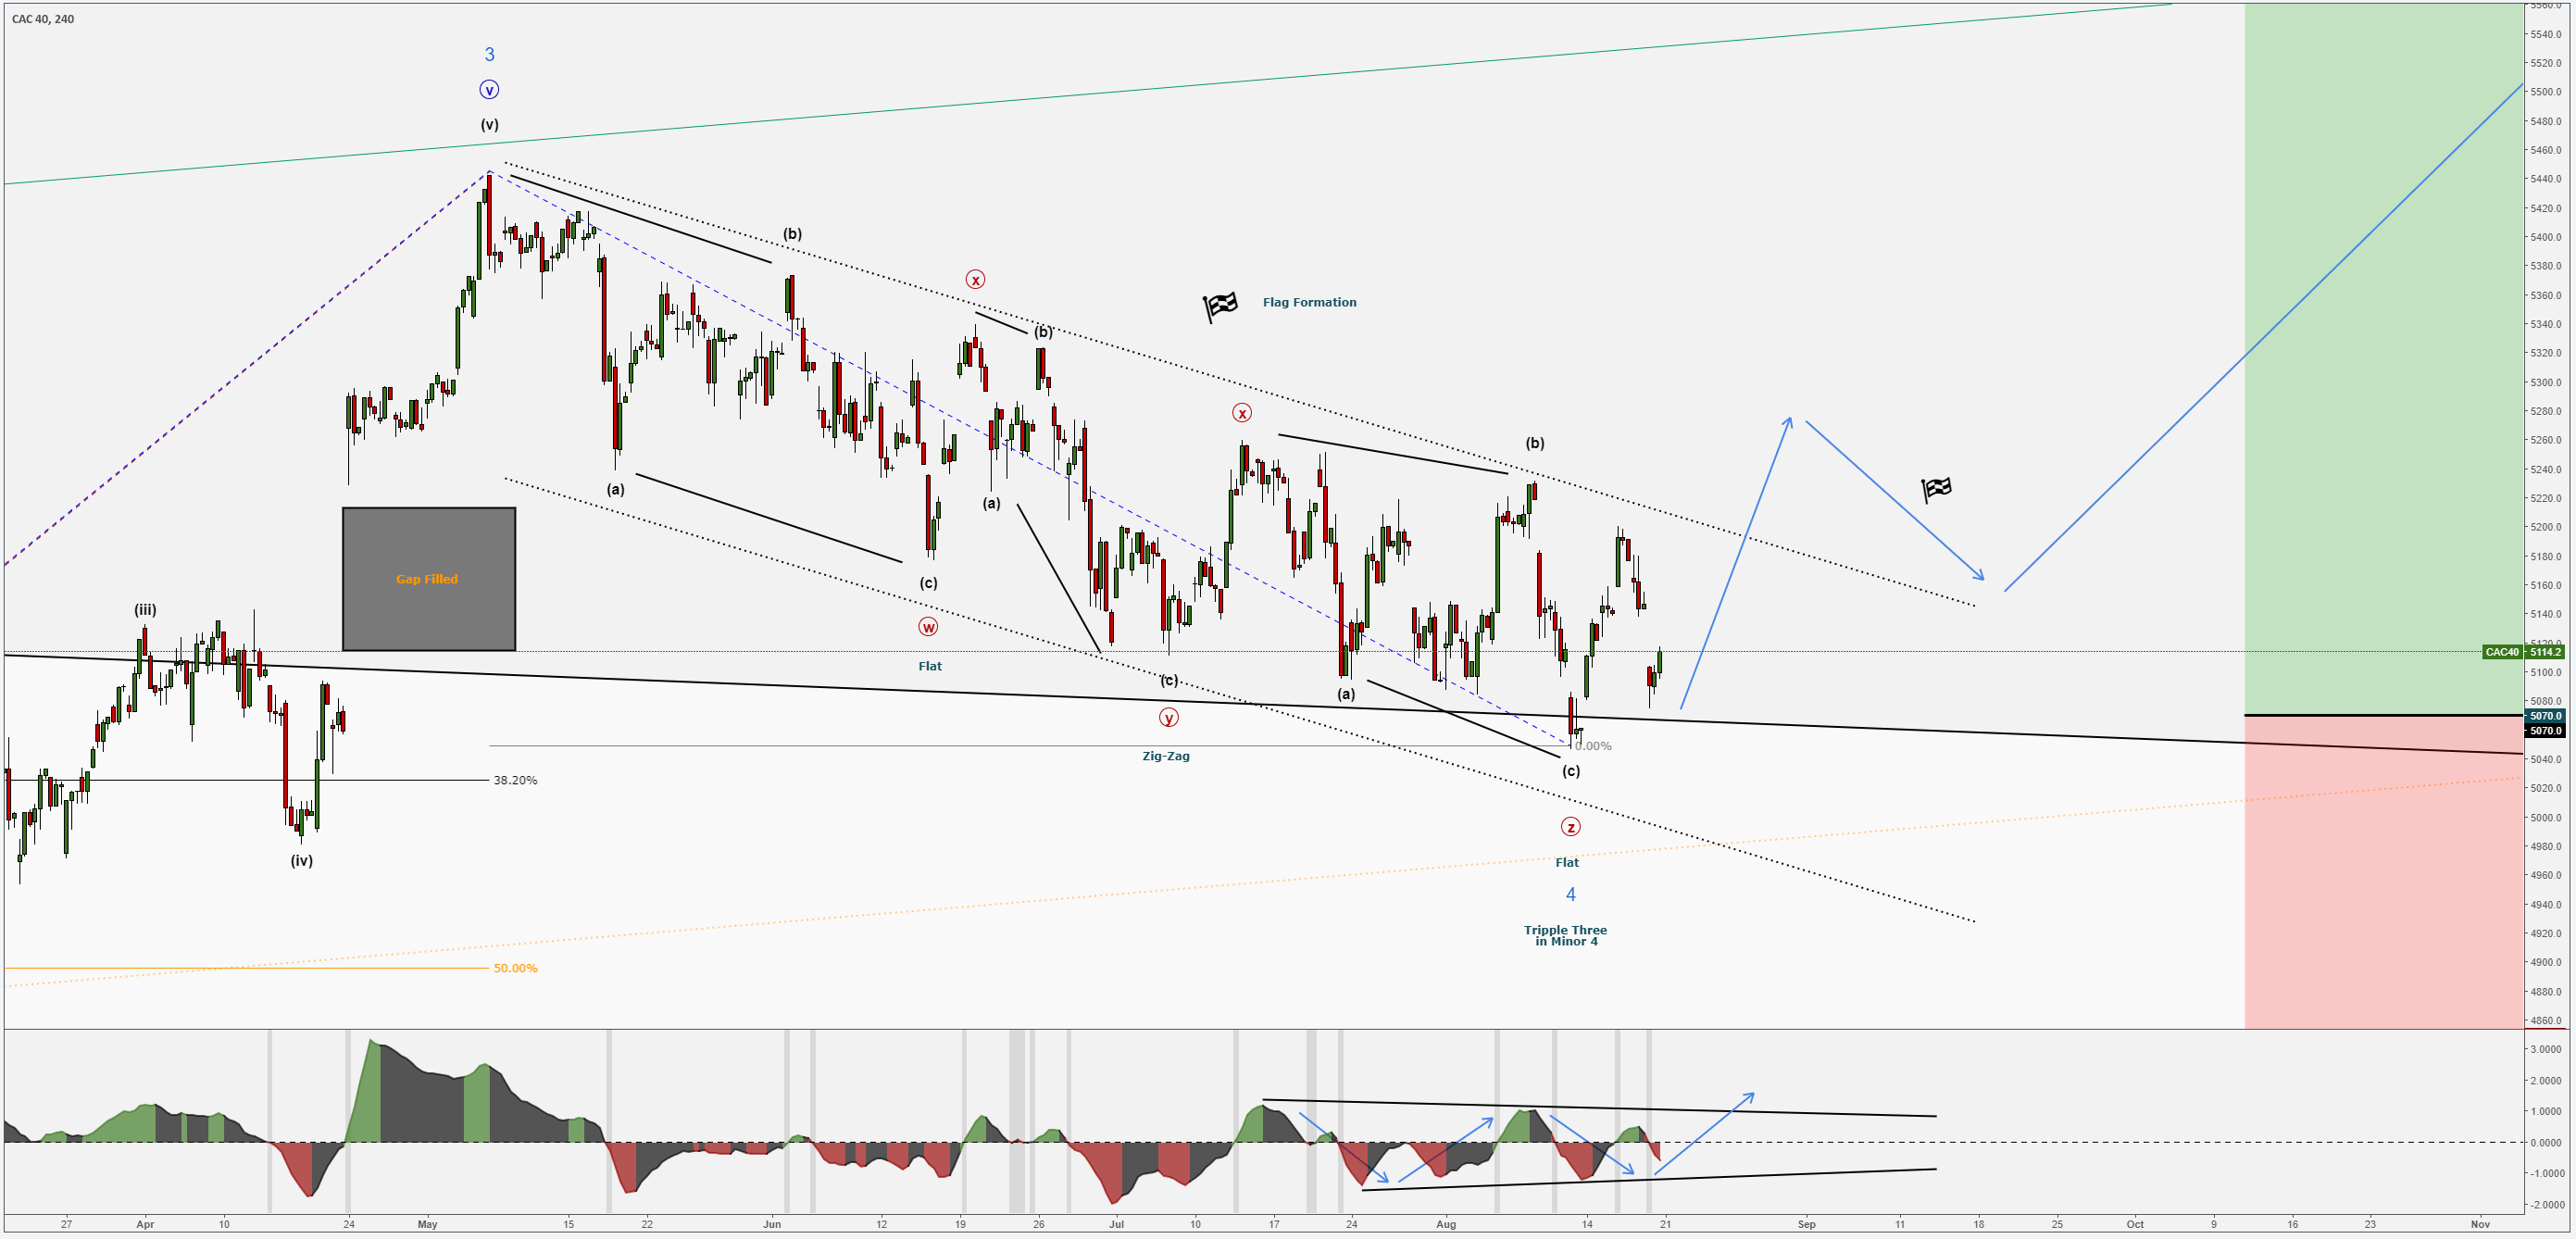
"Minor 4 (light blue) unfolded as a Complex Triple Three WXYXZ (red) Structure, sliding within a Descending Triangle and forming a Flag right above the upper Triangle Trend-Line, as if it would ‘’kiss it good bye” after it filled the gap and causing a Bullish Divergence."
CAC40 – Bullish Minor 5:
- Level in Focus – 5070.00
- Invalidation – 4850.00
- Targets – 5700.00 & 6100.00
Safety Measures:
- When in the green, moving SL to break-even or in profit.
- If Conservative, waiting for Descending Channel Breach and a Flag Formation afterwards.
* The above Analysis does not act as a direct investment advice and should be treated as market commentary.
Many pips ahead!
RT
Author

Richard Tataru
XGlobal Markets
Richard is a market analyst and holds the role of Senior Account Manager at XGLOBAL Markets. He is passionate about technical analysis and has been exploring the charts for years.


