CAC 40 – False Break @ Multi-Year Support (Weekly chart)

Price Action Context
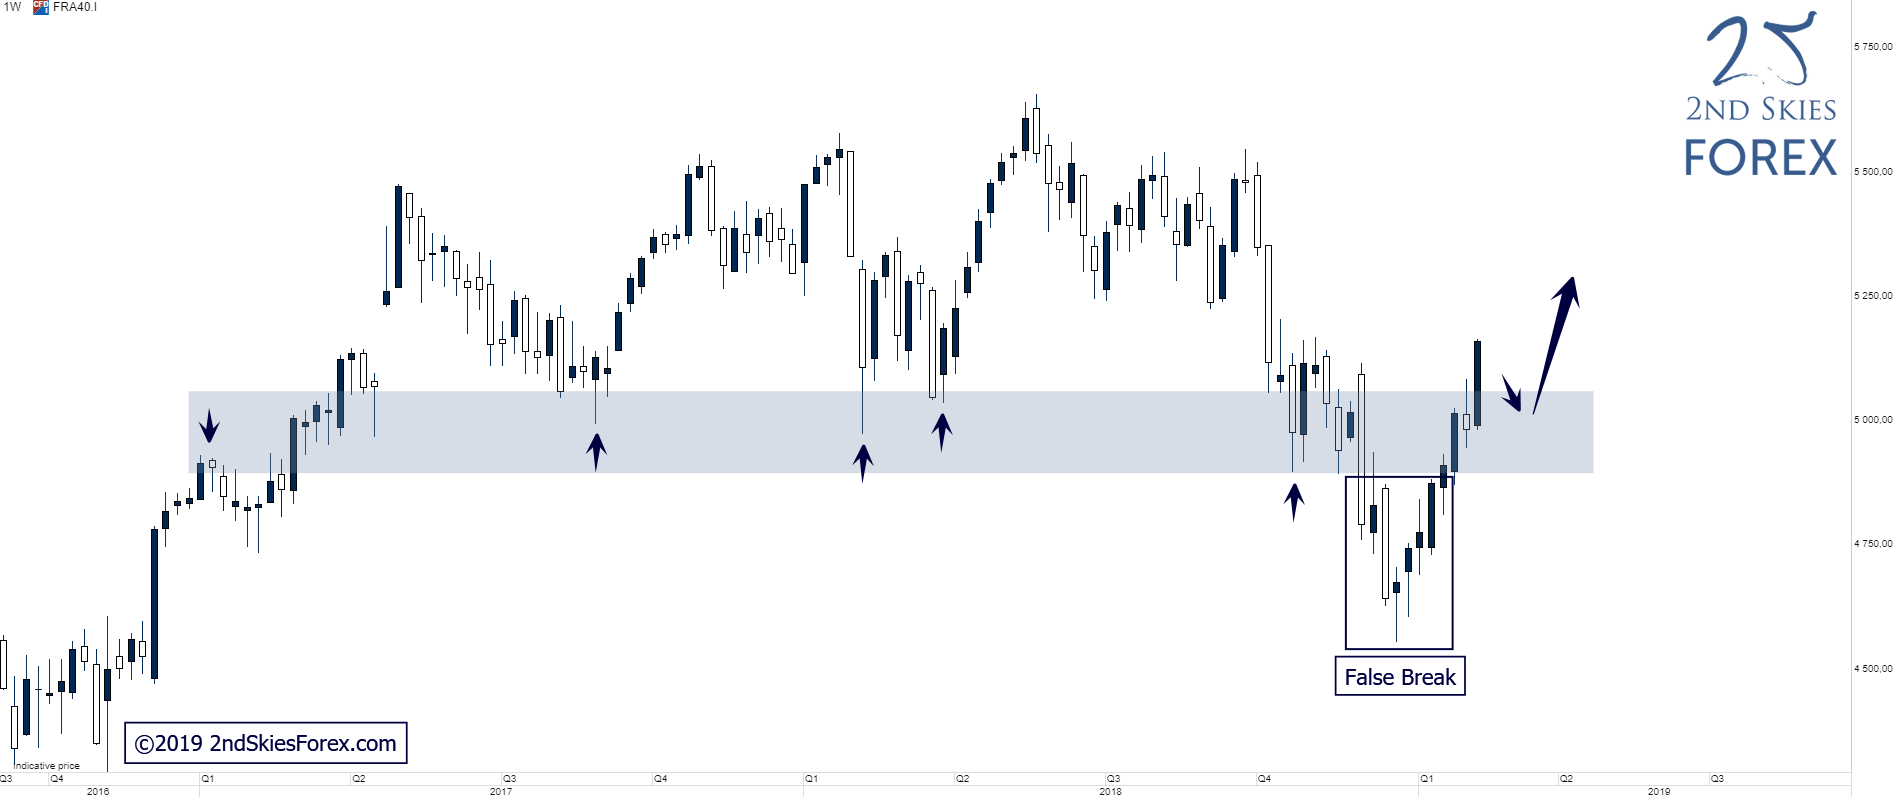
Many global indices have been climbing steadily this year, and the French index is no exception, with 7 out of the 8 last weekly closes being bullish. The index has now clearly broken and closed back above the multi-year support, leaving a false break in its trail, suggesting that a move up towards 5 500 is likely if this multi-year S/R zone (now support) holds.
Trending Analysis
LT bias changed back to bullish and bulls can look for potential trading locations on weak pullbacks into the key support.
Key Support & Resistance Zones
R: 5 500 – 5 660
S: 4 900 – 5 070
Visit our website at 2ndSkies for more price action content, free trading lessons, strategies and videos. Find out how we can help you to change the way you think, trade and perform.
Author

Chris Capre
2ndskiesforex
Chris Capre is a professional forex trader and mentor specialized in Price Action trading, and the Ichimoku Cloud.


