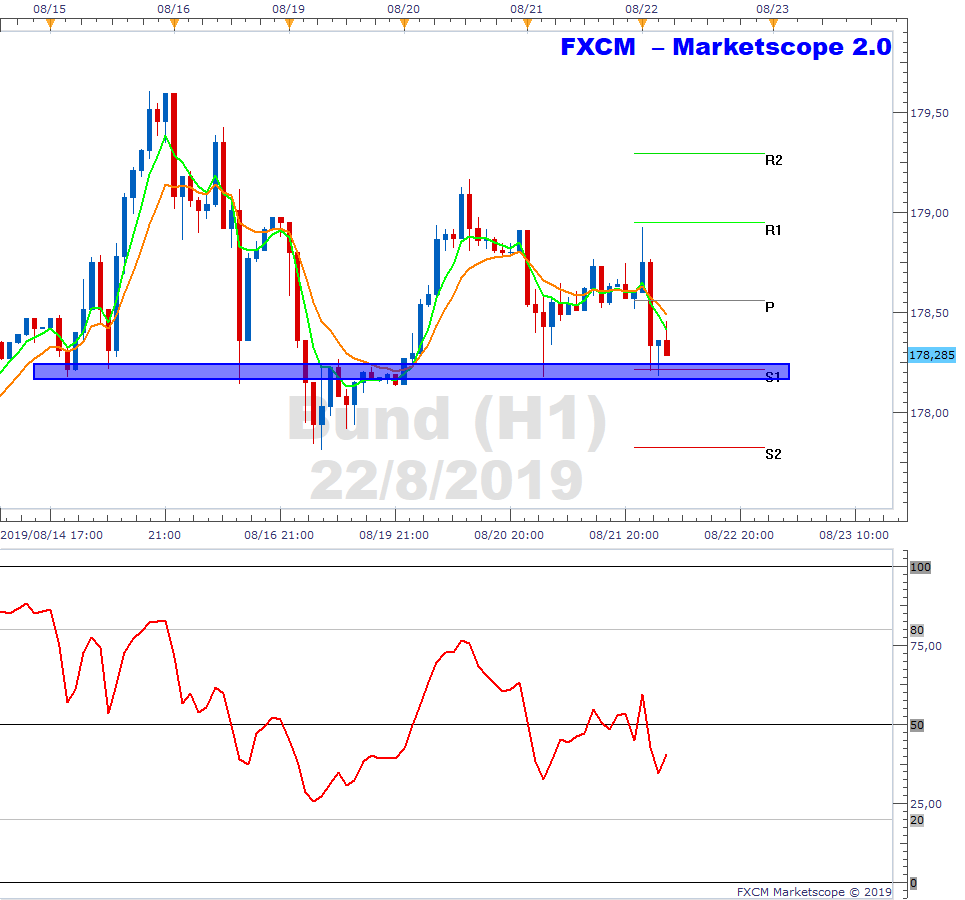
Bund Price Approaches Underlying Support on H1 Chart

The below is the hourly chart of the Bund. Price has pulled back to the S1 pivot – a level which overlaps with price support (blue shaded horizontal). This may be an attractive level to buyers and price may react positively off of this area. We are looking for the green 5-hour EMA to cross above the orange 10-hour EMA and for the RSI to move above 50 to signal a potential bullish bias. As such, we continue to monitor.
Past performance is not an indicator of future results.
CHART SOURCE: FXCM MARKETSCOPE 2.0
Author

Russell Shor (MSTA, CFTe, MFTA) has an Honours Degree in Economics from the University of South Africa and holds the coveted Certified Financial Technician and Master of Financial Technical Analysis qualifications from the Interna
More from Russell Shor, CFTe, MFTA


