Bulls Still in Charge
Market overview:
After reaching 2508, SPX consolidated for a few days down to 2489, and when it failed to go lower but broke above 2510 instead, it identified the correction as a re-accumulation pattern which carried a potential count to about 2575. I thought that there would be a phase consolidation taking place between 2530-2540, but the index continued to march higher to the next phase count of about 2550 which was reached last Thursday. Friday’s job report was an occasion to take some profits, as well as to acknowledge a minor cycle low which I initially thought would surely come a few days earlier. Although the index started to move back up on Friday after a correction of only 7 points,it’s unclear if the cycle has made its low (Friday being the ideal date) or if it will extend into early next week. If so, it could reach down to about 2540 before resuming its uptrend toward the higher projection.
There has been so much momentum behind this move that the daily oscillator, which had shown some divergence at the 2508 top, went on to make a new high by a small margin, thereby eliminating the divergence entirely. This should lead to a higher high, whether we go up from here, or correct a little more first.
In this super-bullish short-term atmosphere, the fear and greed index made a new “extreme greed” all-time high of 95 (max. 100), telling usthat the market is as short-term overbought as it ever gets.
Analysis: (These Charts and subsequent ones courtesy of QCharts.com)
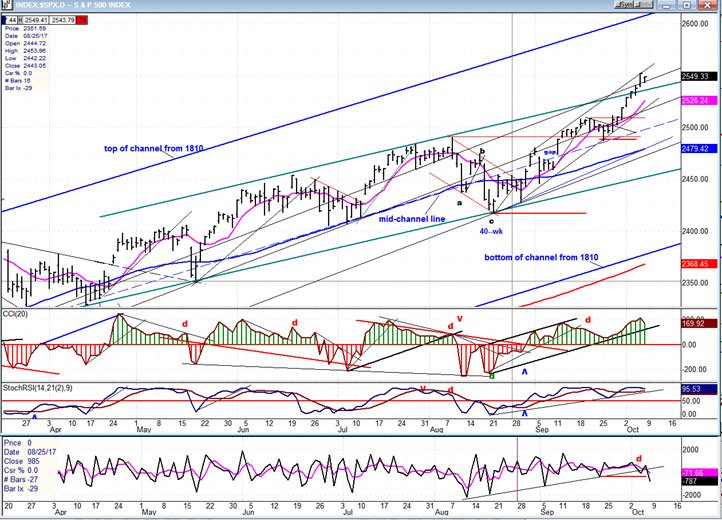
Daily chart
It takes a lot of buying to push through the top of a channel which has contained prices for a little over six months! As the index stubbornly refused to come down, those sitting on the side lines became more and more fidgety and finally could not resist the temptation of jumping on board. It also most likely took the assistance of massive short-covering to do so. Once in a while, large traders have an opportunity to keep prices in an uptrend until both of the above occur. This was (is) one of them.
As stated above, it is almost inconceivable for a market that has so much upside momentum to make a top at the same time as its oscillator peaks, without first creating negative divergence. That, and the fact that higher counts can be derived from the last re-accumulation pattern, practically assures us that after this minor correction is over, a new high will be seen in the SPX. Friday’s action also tells us that this is unlikely to be a blow-off move. These go straight up and then come straight down without forming any congestion at their highs. However (and there is always a “however”),should prices begin to retrace too much, say below 2532, we should be on the alert for selling beginning to feed on itself. If the correction that started on Friday continues, a retracement down to 2540-41 should take place unless we spend more time extending the existing distribution pattern first, to create a lower count. But it is not likely that a 13-wk cycle whose low was due Friday, and is still declining, would allow this to happen; so we are either done and ready to extend the rally, or we should see lower prices first thing Monday.
Although weakness is nowhere to be found in the momentum oscillators, this is not the case with the A/D indicator which not only retained its negative divergence, but went lower on Friday.
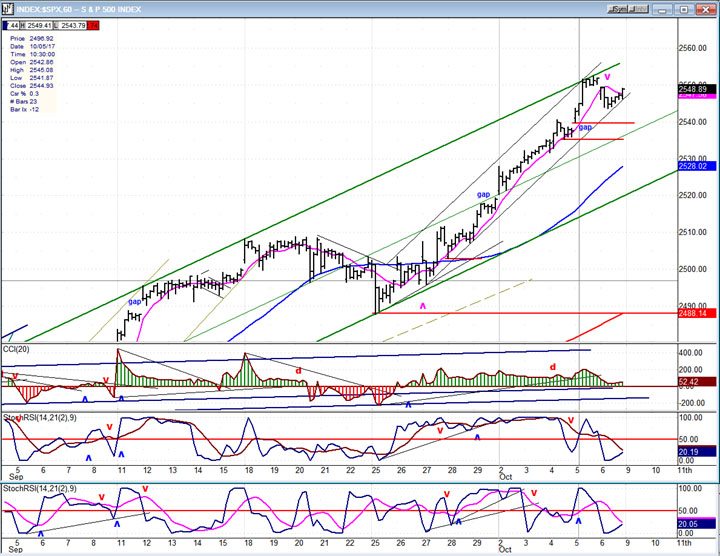
Hourly chart
Very unusual forthe last 63 points of a 134-point uptrend to haveonly 3 or 4 point pull-backs along the way. This is the sort of thing that you find at the beginning of a bull trend, not after all these months have passed since the 1981 low. It probably does foreshadow the ending of the trend, but is not quite the blow-off pattern that many expect.
As you can see on the chart, shortly after the trend from 1489 started, the hourly CCI went green and stayedgreen, its negative divergence being ignored and overcome(as in the daily charts). There are two open gaps in thatlast stage and a deeper correction than we had on Friday could retrace down to fill the top one, or stop at the upper end of the gap. We’ll have to see.
The hourly pricesalso traced out a good channel in the last stages of this advance, and stopped on its top line. Again, since we went all the way to the top (as well as having gone through the top line of the daily channel), it is very likely that we have not seen the high of the move, but will probably extend the minor correction and make the next high with deceleration showing in the daily oscillators.
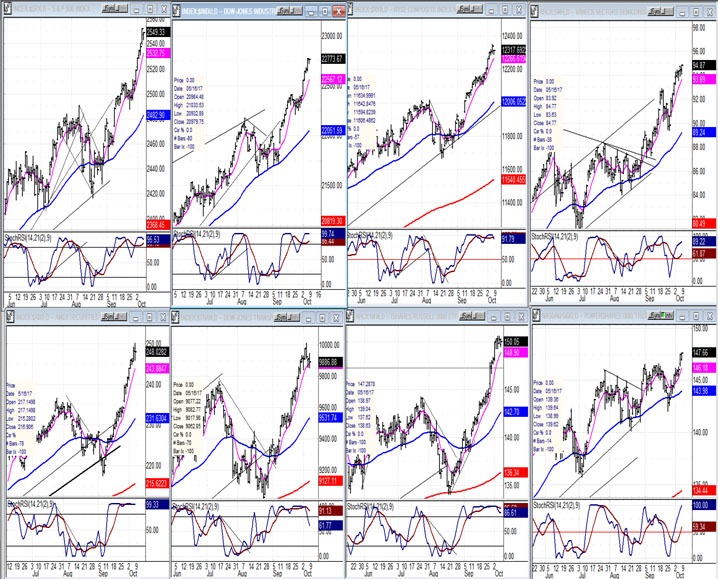
An overview of some important indexes (daily charts)
With all the indexes below making new highs, there is no sign of a top yet, although QQQ’s (bottom right) lagging action could be an early warning. Next week should give us better clues about what to expect, near-term. If 2575 is the next important target for SPX to reach, some advance notice should be given by TRAN and IWM (second and third on bottom tier), along with QQQ.
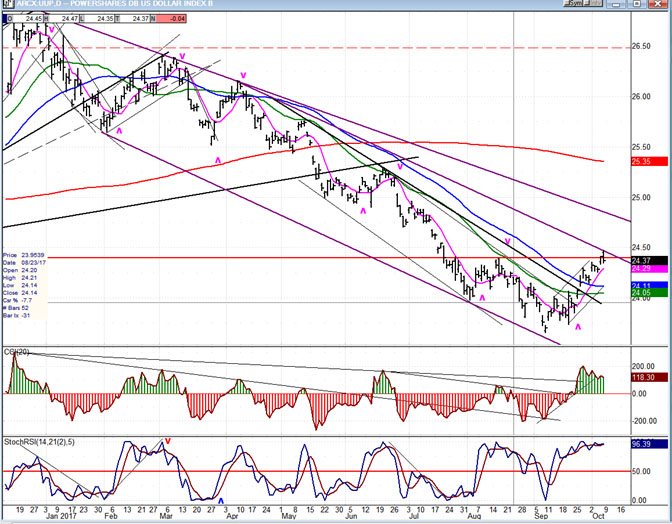
UUP(dollar ETF)
After a lengthy and deep correction, UUP has found a low and is ralying. It is unlikely to progress very far without first creating a good base, and it is already finding resistance at its upper corrective channel line.
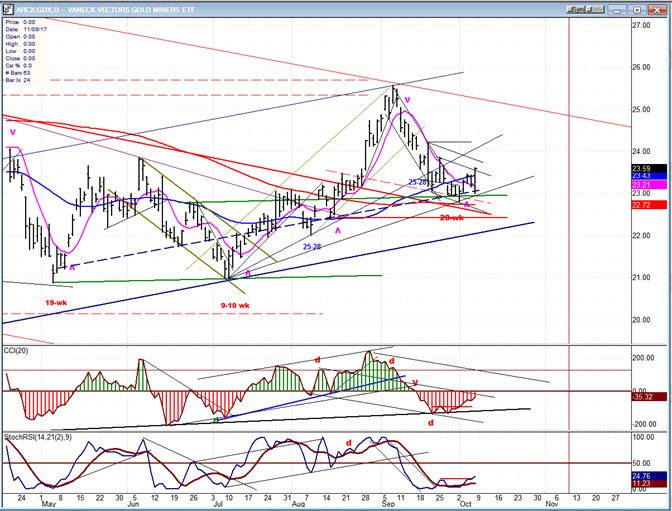
GDX (Gold Miners ETF)
GDX successfully re-tested its low after finding some ready buyers, last week. Since it has started a higher low/higher high pattern over the near-term, this move could have farther to go. Note, however that the daily oscillators will have to become positive before we can expect a serious uptrend to take place. This is most likely reserved for the end of the year since two dominant intermediate cycles will be bottoming about two weeks apart in early December.
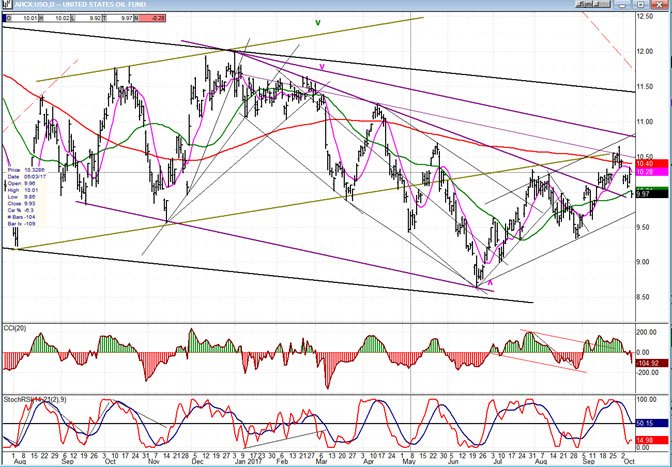
USO (United States Oil Fund)
USO found resistance where expected and has reversed. So far, it is only back-testing its broken channel line, but if it fails to make a new high and re-enters its corrective channel, it could be suggesting that it will re-visit its lows -- and perhaps more!
Summary
SPX failed to take a breather at the 2530-40 phase count derived from the re-accumulation pattern created at the 2500 level. Instead, unusually strong upside momentum which drove the fear and greed index to new, super greed highs marched on to the next count of 2550. After a minor correction, the index is expected to complete its rally from the 2500 low at about 2575 and start another consolidation/correction.
Author

Andre Gratian
Market Turning Points
When I was a stock broker years ago, a friend introduced me to technical analysis of the market and it is not an exaggeration to say that I fell in love with this approach! Ever since then, it has become an increasingly important


