Bull Trap

Are we in a typical bull trap? According to Investopedia, a bull trap is as follows:
"A bull trap is a false signal indicating that a declining trend in a stock or index has reversed and is heading upwards when, in fact, the security will continue to decline. The move "traps" traders or investors that acted on the buy signal and generates losses on resulting long positions. A bull trap may also be referred to as a whipsaw pattern."
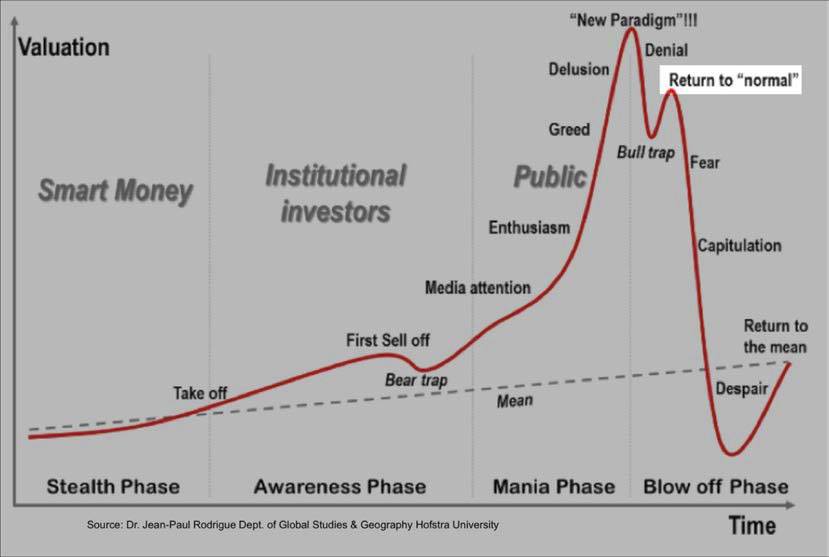
Chart 1: Classic Bull Trap and the Return to Normal
We can only answer this question in hindsight. The truth, at the end of the day, is that no one knows. Our goal is to use a quantitative framework to ascertain where probabilities suggest we are headed next. There is always randomness, chance, and uncertainty. Just because probabilities suggest that the odds are in favor of a particular outcome, doesn't mean that outcome will occur.
Our framework uses valuations, market sentiment, economic growth, and fed policy to determine probable direction in capital markets. Accordingly, the evidence suggests that what we are experiencing in equities markets is a typical headfake, or bull trap. What that means going forward is that stock markets globally are still likely susceptible to a higher volatility regime. We are not implying that markets have to crash, although many have already done that. What we are suggesting is a defensive posture on the margin: focus on managing risk, not enhancing returns.
Valuations still suggest that returns are going to be well below average. If you look at US Household Equity Holdings versus subsequent stock market returns, the proposed market returns over the coming 10 years should be far below average. The path is unknown, and that is why valuations are only a quarter of our framework. Nevertheless, they indicate a late secular cycle environment.
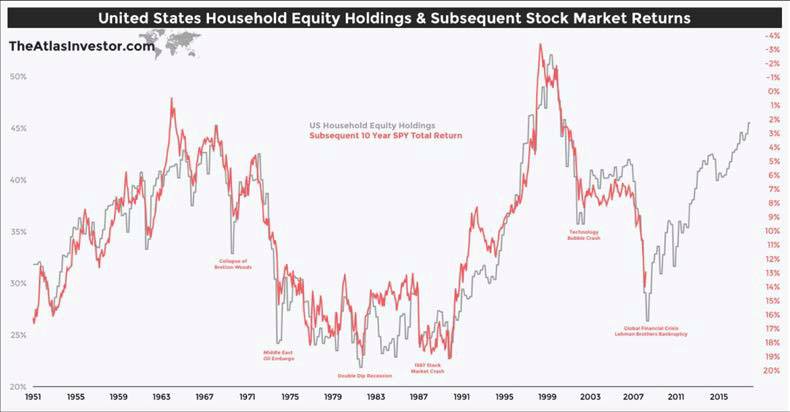
Chart 2: US Household Equity Holdings versus Subsequent Stock Market Returns;
Market trends still suggest that sentiment is progressively deteriorating. However, we have seen an impressive improvement in trend indicators since the end of 2018. If we get continued improvement, we would expect the trend component of our framework to change to green (positive) from the current red (negative) condition.
Author

Clint Sorenson, CFA, CMT
WealthShield
Managing Partner of Emerald Investment Partners, LLC and Co-Founder of WealthShield, Clint has long been dedicated to innovating and accelerating the investment landscape.


