BTCUSD Elliott Wave and Technical Analysis

Two scenarios for Bitcoin and a clear price point which differentiates the two ideas are presented in this analysis.
Summary: While price remains below 13,031.04 and below the Magee bear market trend line, the possibility that Bitcoin is in the early stages of collapse will remain. A new high above 13,031.04 by any amount at any time frame would be a bullish signal for Bitcoin. If that happens, then look out for another exponential rise to substantial new highs, which may only end after a minimum of 2 weeks vertical upwards movement on high volume.
The data used for this analysis now comes from Yahoo Finance BTC-USD.
FIRST ELLIOTT WAVE COUNT
2 WEEKLY
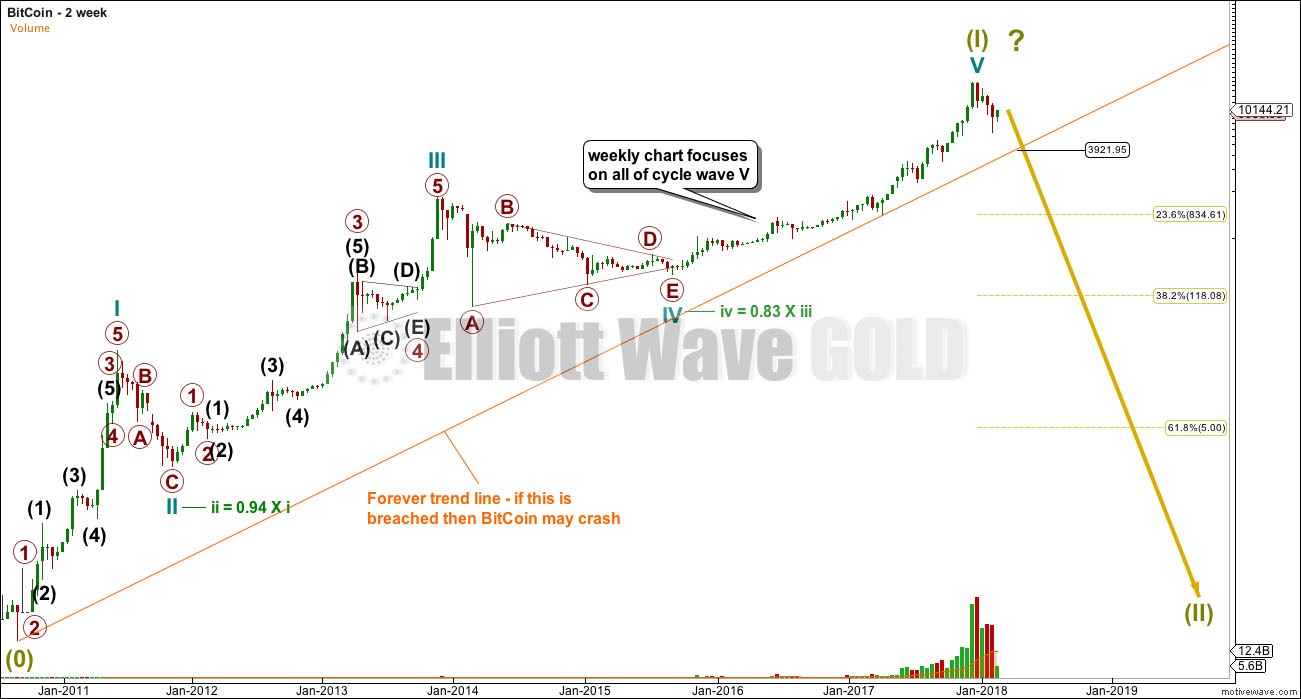
It is possible to see a completed five wave impulse upwards for Bitcoin.
I am unable to find reasonable Fibonacci ratios within this wave count. It appears that Bitcoin may not exhibit Fibonacci ratios very often between its waves, so this makes target calculation impossible. Classic technical analysis will then be used to identify a high in place.
What is very clear from this chart is that Bitcoin is in a classic bubble. This looks like an even larger bubble than the Tulip Mania. The only thing about which I am certain is that this bubble will pop and Bitcoin will collapse.
What is uncertain is exactly when it will crash. For that question to be answered Elliott wave analysis may be helpful, and if the Forever trend line is breached, then reasonable confidence may be had that Bitcoin is crashing.
WEEKLY
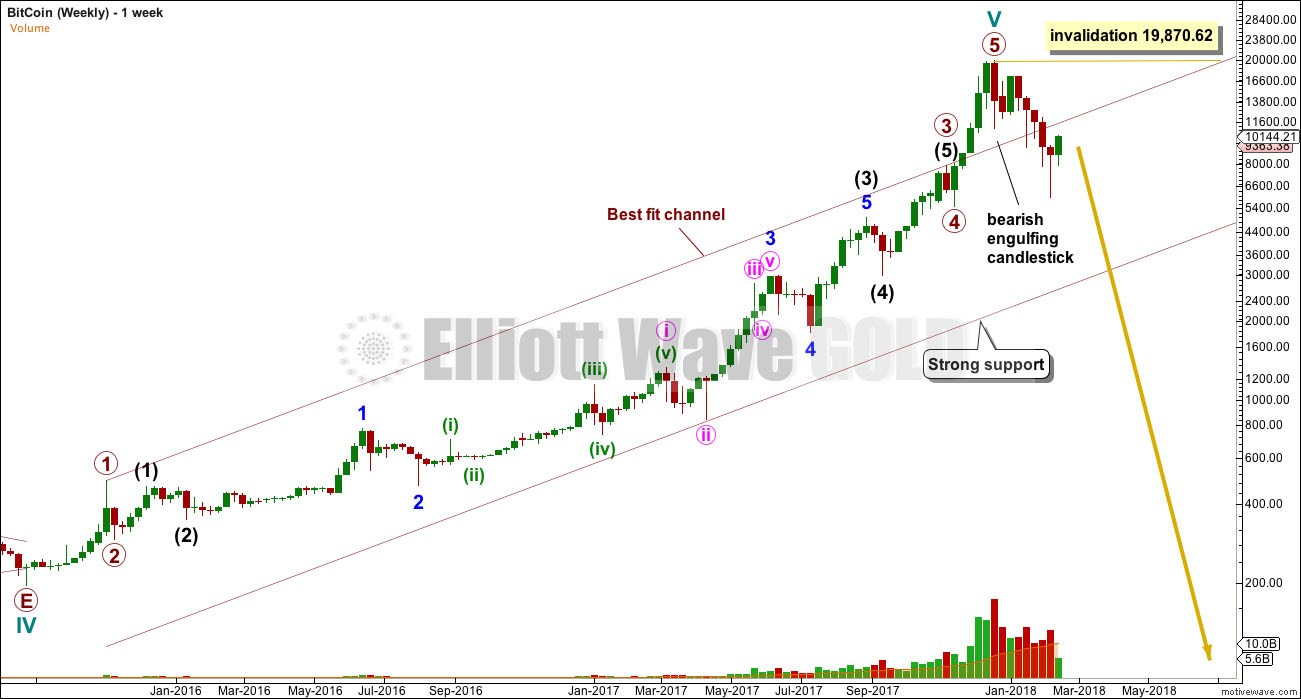
Bitcoin tends to behave like an extreme commodity: price moves upwards for about 2 – 4 weeks in a near vertical movement at the end of its rises. Following this vertical movement the resulting downwards movement is very deep (in percentage terms) and often very quick.
The next rise begins slowly with basing action over weeks or months, and then as the rise nears its end another vertical movement completes it. Also, there are volume spikes just before or at the end, which is another feature typical of commodity like behaviour.
This has happened now several times. The most notable instances are the rise up to the week ending 24th
November, 2013, and the week ending 5th June, 2011. The following sharp drops were 94% and 93% respectively.
If this current drop continues like the last two examples, then a reasonable target may be about $1,390.94 or below.
DAILY
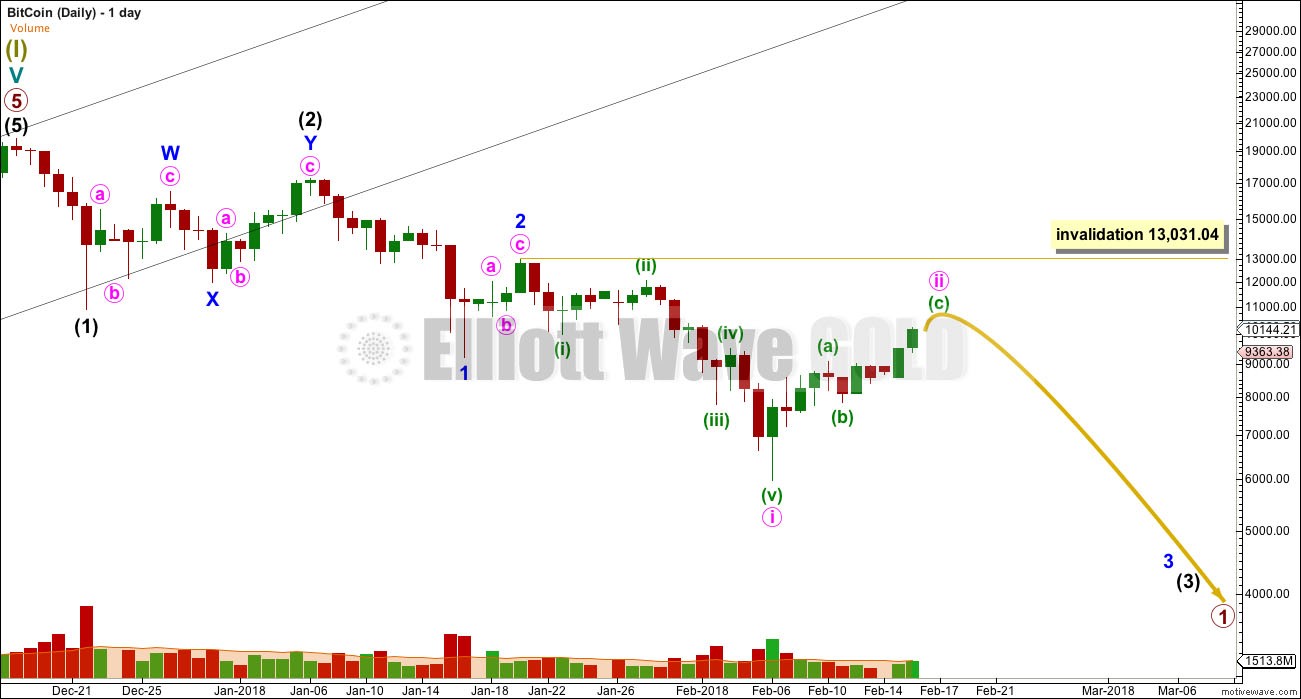
If Bitcoin is in the early stages of a huge crash, then a five down structure should develop at the daily chart level. This would be incomplete.
A third wave cannot yet be seen as complete for intermediate wave (3). This wave count sees a series now of three overlapping first and second waves. If this wave count is correct, then Bitcoin may be winding up for a spectacular plummet in price in the next couple of weeks or so.
Minute wave ii may not move beyond the start of minute wave i above 13,031.04.
SECOND ELLIOTT WAVE COUNT
WEEKLY
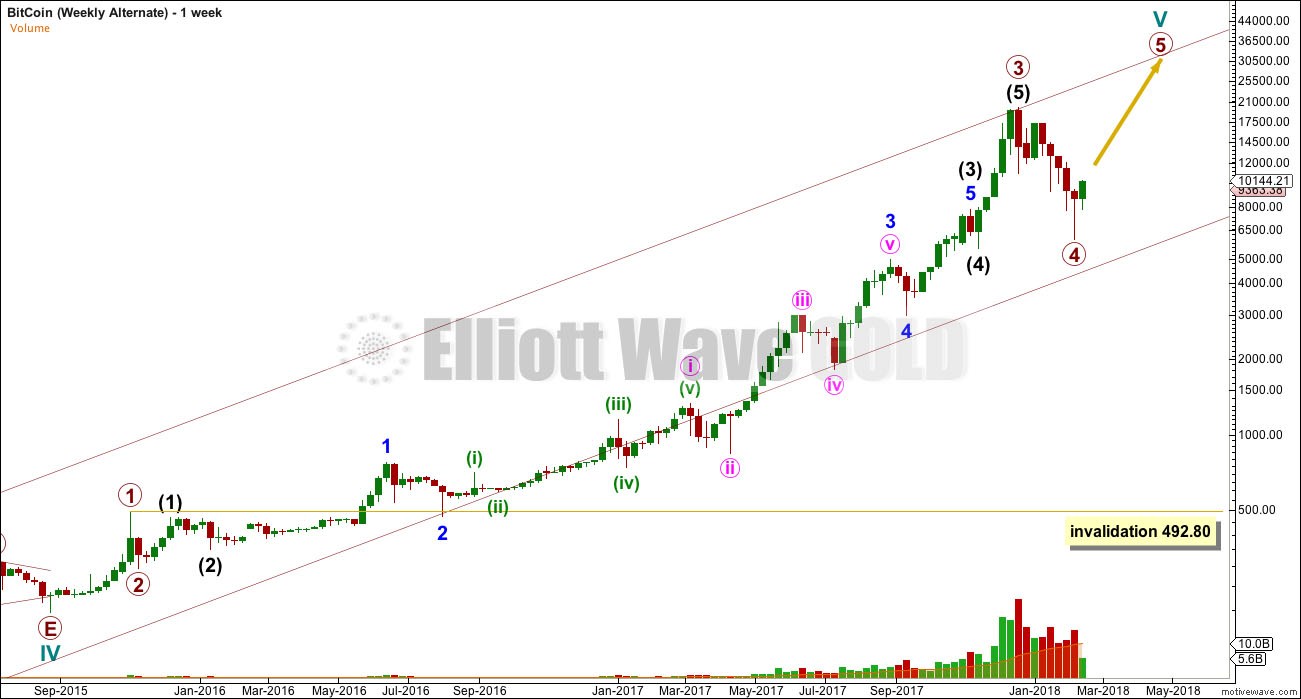
It is also possible that the rise for Bitcoin is not over. The last blow off top may have only been the end of a third wave, so a still stronger fifth wave may be yet to come.
Primary wave 4 may not move into primary wave 1 price territory below 492.80, but this price point is far away for any usefulness though. The Forever trend line on the 2 weekly chart would see this wave count discarded long before price invalidated it.
DAILY
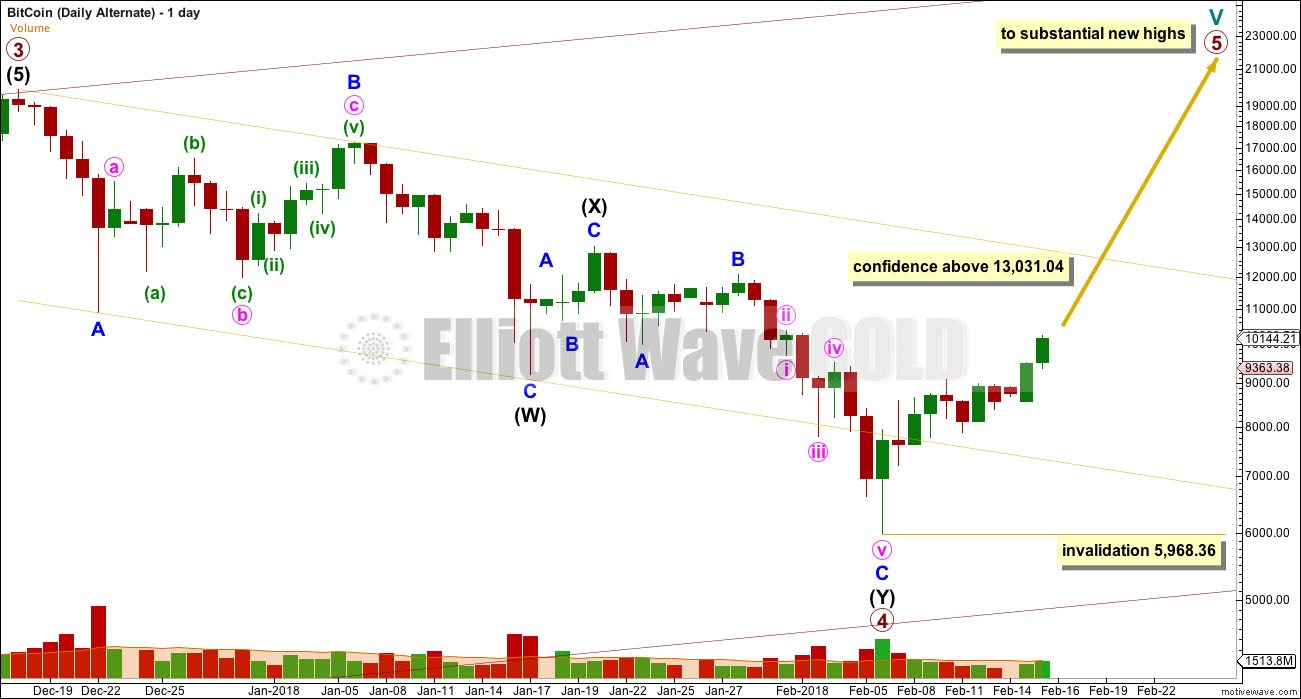
If the last fall in price for Bitcoin is just another relatively short lived pullback, then it must subdivide as an Elliott wave corrective structure. This movement will fit nicely as a double zigzag, which may now be complete.
Because triple zigzags are very rare structures (I have only ever seen 2 or 3 in my now 10 years of daily Elliott wave analysis), it is extremely likely that the correction is complete when a double zigzag is complete.
Within primary wave 5, no second wave correction may make a new low below the start of its first wave below 5,968.36.
A new high above 13,031.04 would see confidence in this wave count. If that happens, then my expectation would be for Bitcoin to see another exponential rise, only ending after a minimum of 2 weeks vertical movement on very high volume.
TECHNICAL ANALYSIS

If price breaks above the Magee bear market trend line, then assume Bitcoin would very likely make new highs.
Not all bullish long lower wicks appear at swing lows, but they are a persistent feature at lows.
When a bullish long lower wick is accompanied by a volume spike, then the probability that a swing low is in is very high.
Currently, volume supports downwards movement much more so than upwards. The volume profile is bearish. This supports the first Elliott wave count.
Become a Successful Trader and Master Elliott Wave like a Pro. Start your Free 14 Day Trial at - Elliott Wave Forecast.
Author

Elliott Wave Forecast Team
ElliottWave-Forecast.com


