Bringing in the backstop

S2N spotlight
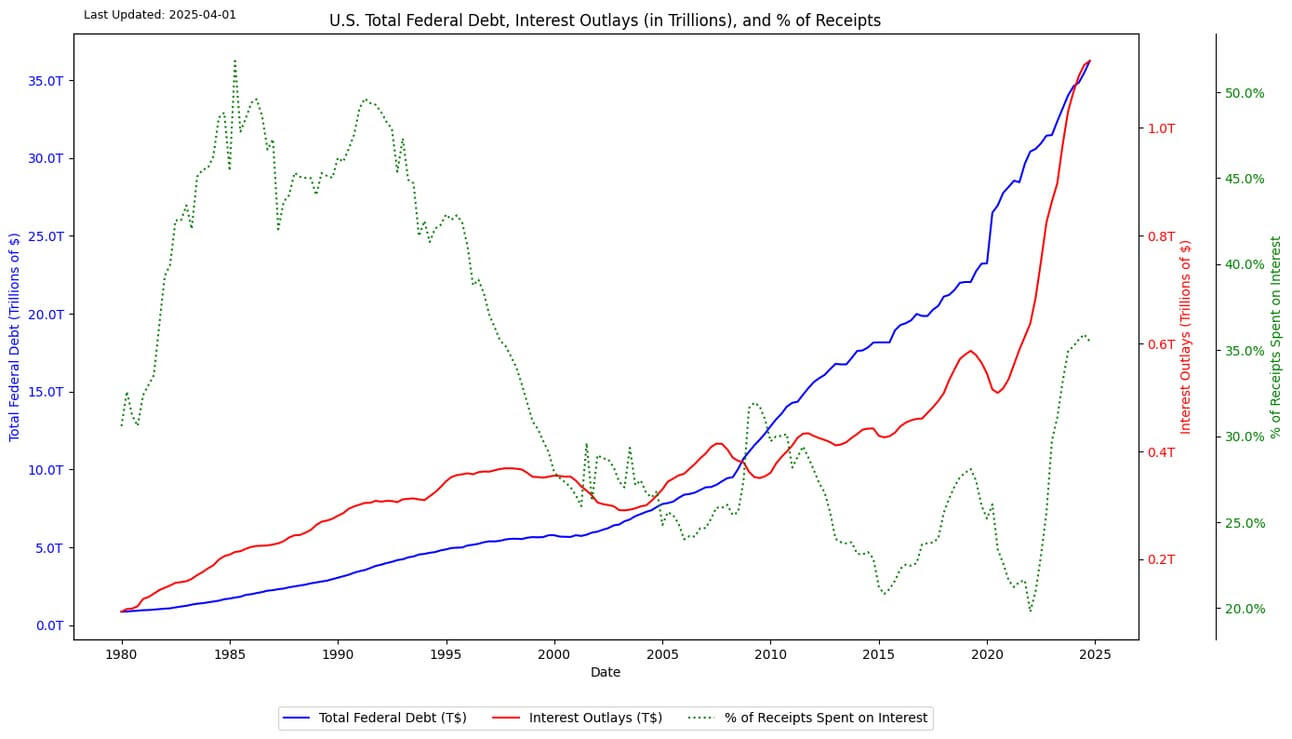
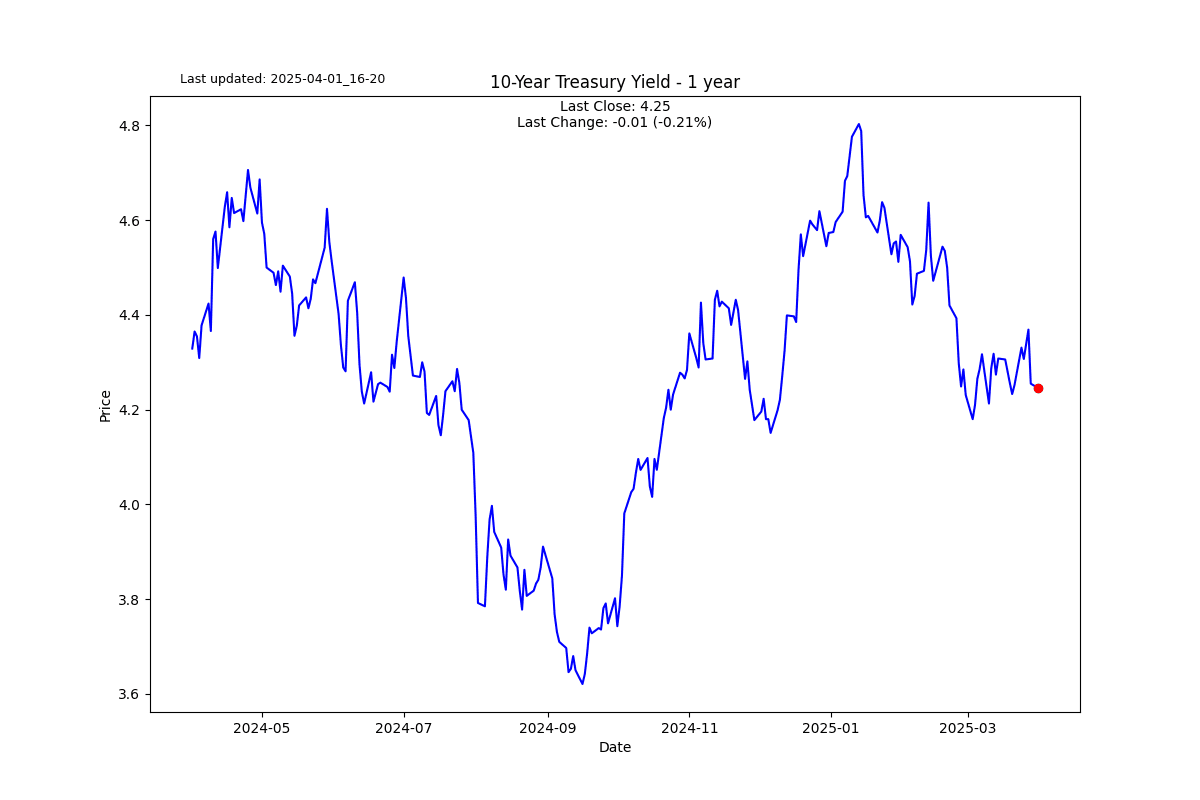
I wrote a few days ago about the fiscal cliff facing the US bond market. The current fiscal debt is sitting at $37 trillion. The issue is that there is $10 trillion that needs to be refinanced this year and a total of $26 trillion over the next 4 years. Foreigners own about 32% of US Treasuries, with a large portion of the foreign investment coming from the global trade surplus that Trump Tarrifs are in the process of eliminating.
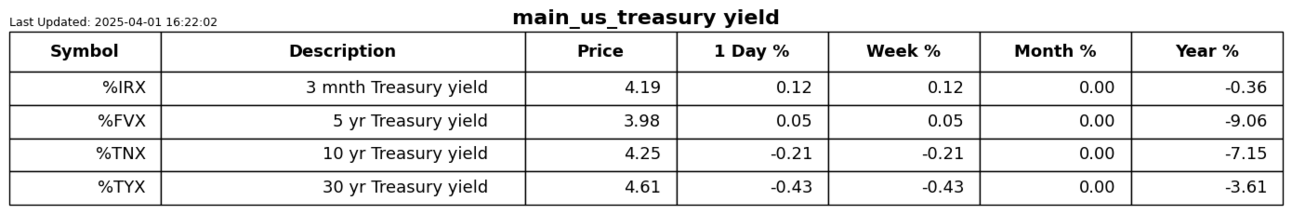
The trillion-dollar question remains: who will buy Treasuries and keep the yield at manageable levels? The next chart has a lot in it, but you can see how interest on the debt is already well above $1 trillion per annum. If rates go up, this will take even a bigger amount than the current 35% of income out of the budget just to pay interest.
Clearly the Fed will become a major buyer to fill any gaps, so you can bank on QE coming, which will eventually be good for equities but bad for inflation. There is another buyer; guess who?
Welcome to the next big Treasury buyer, Commercial Banks.
The Supplementary Leverage Ratio (SLR) is a regulatory requirement introduced under the Basel III framework. It is designed to ensure banks hold sufficient capital against all of their on- and off-balance-sheet exposures, rather than only risk-weighted assets.
During the pandemic the Fed temporarily exempted Treasuries from the SLR calculation. This enabled banks to step in and buy Treasuries without hurting their SLR limits.
I believe Treasurer Scott Bessent is all over this; you can be sure that the Trump administration will be doing its best to permanently reform this regulation.
We know that Bessent is already planning to issue fewer long-term Treasury notes to push up demand through limited supply, just like Janet Yellen did but says she didn’t do. Naturally this has its own risks, which we will discuss another time.
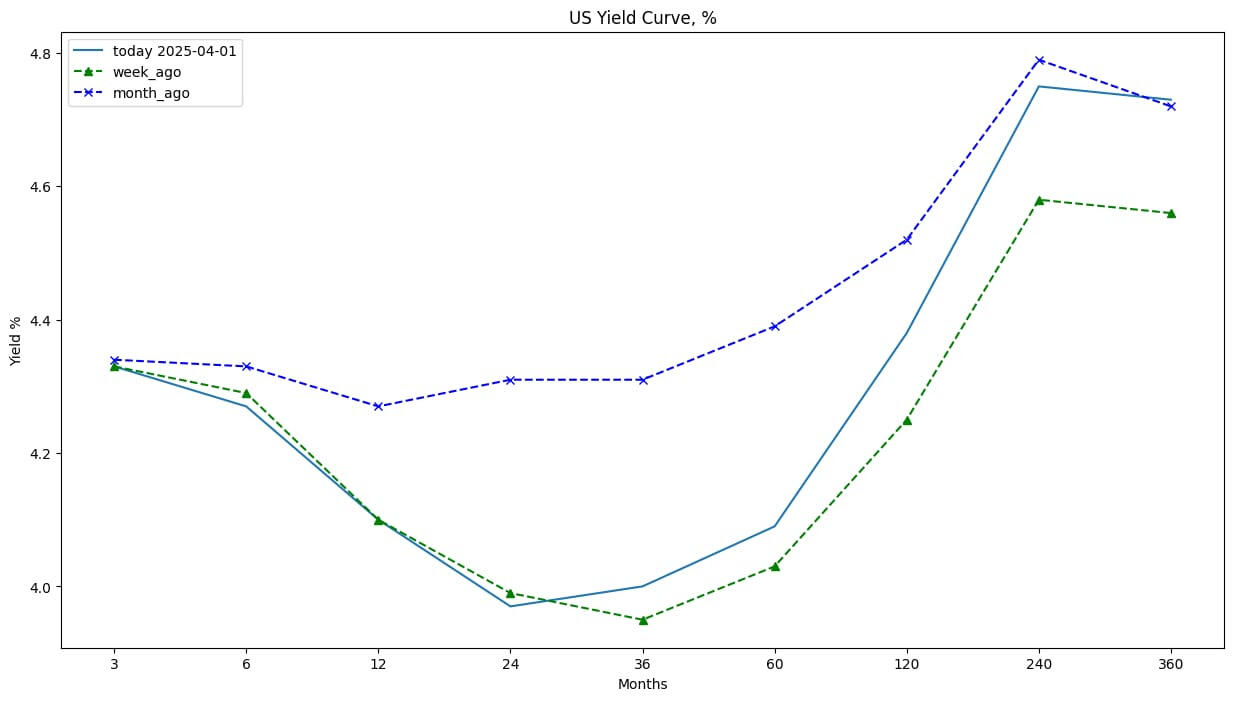
The current yield curve has shifted more times in the last month than John Travolta in Saturday Night Fever. The bond market is nervous and unclear how this all plays out.
S2N observations
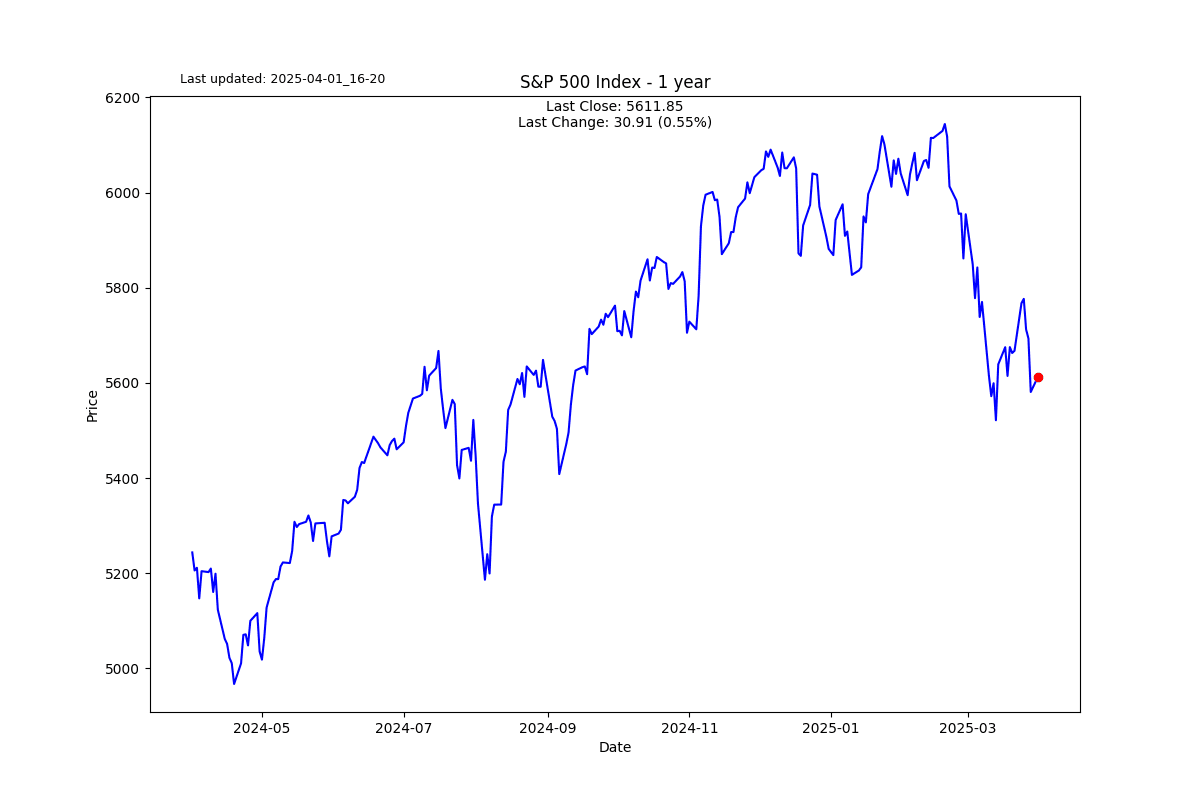
They say the trend is your friend; well, how friendly is the current trend?
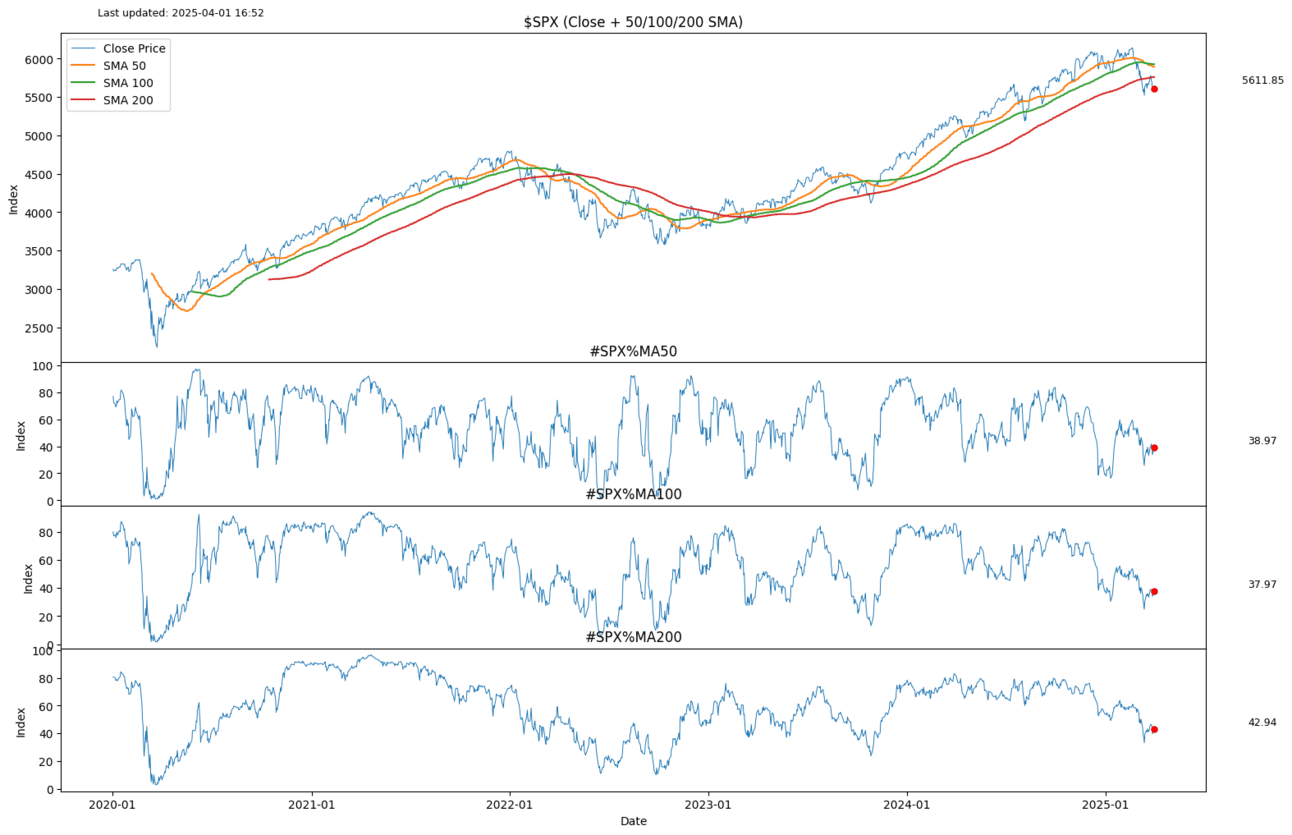
I think the next chart packs a lot in. I have presented the 50-, 100-, & 200-day moving averages on the S&P 500 in the top chart. You can see that the current price is below all three moving averages, suggesting the uptrend is over.
In the bottom 3 panes, you can see the % of the 500 constituent companies that are above their respective 50-, 100-, & 200-day moving averages. Market breadth is clearly out of breath.
S2N screener alert
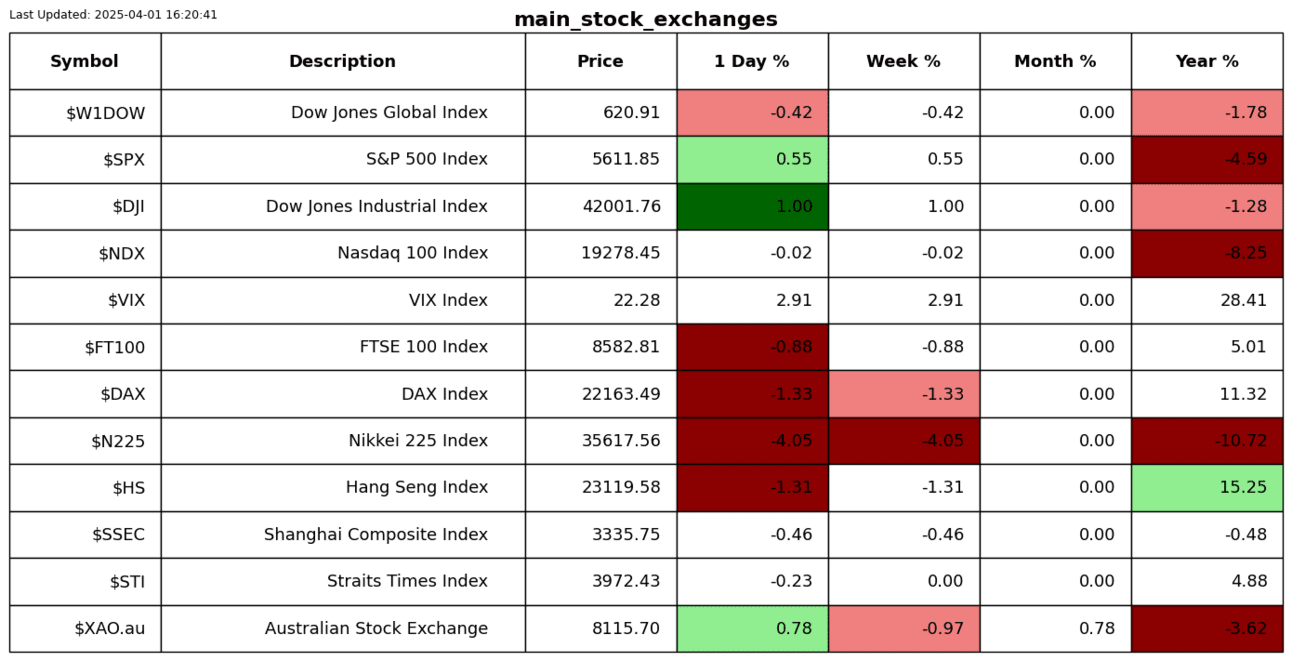
Taiwan’s main stock index took a 4% beating yesterday.
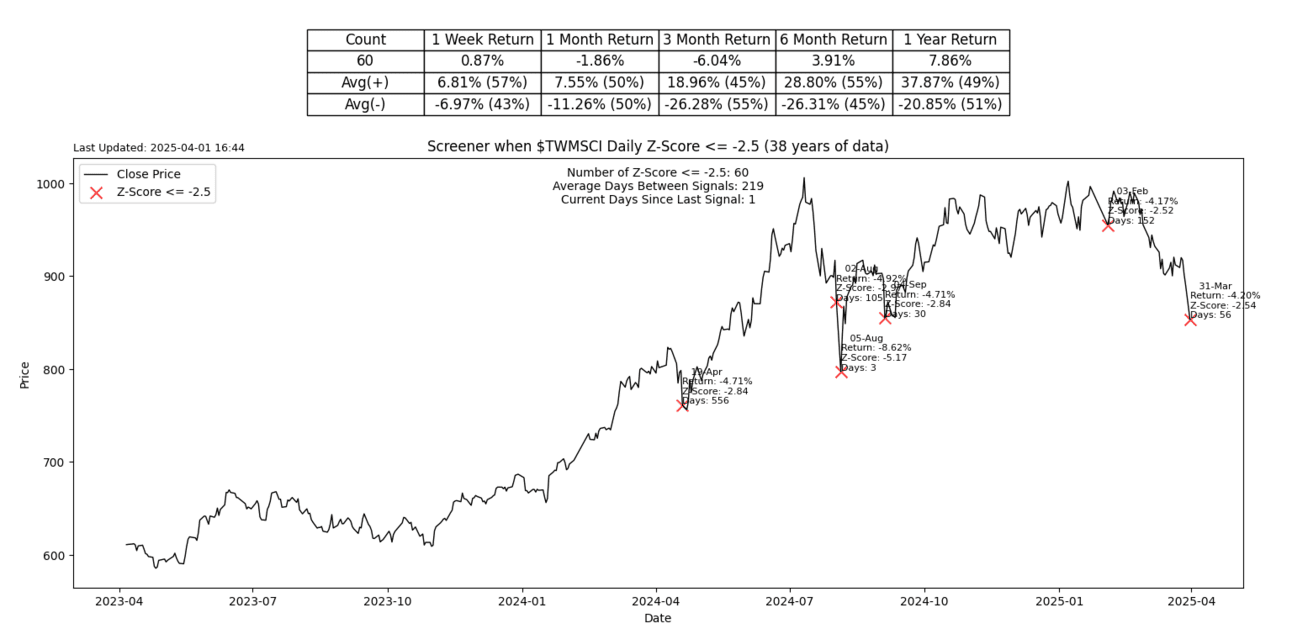
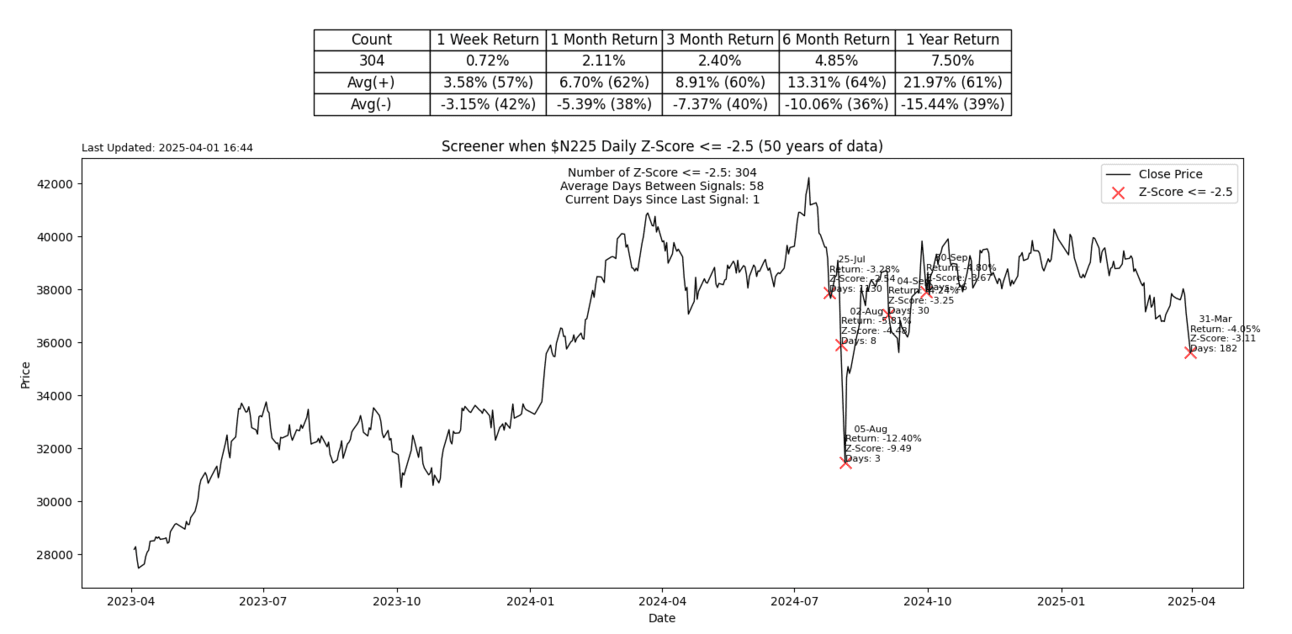
The Nikkei also took a 4% beating, with a slightly worse Z-score of 3.11.
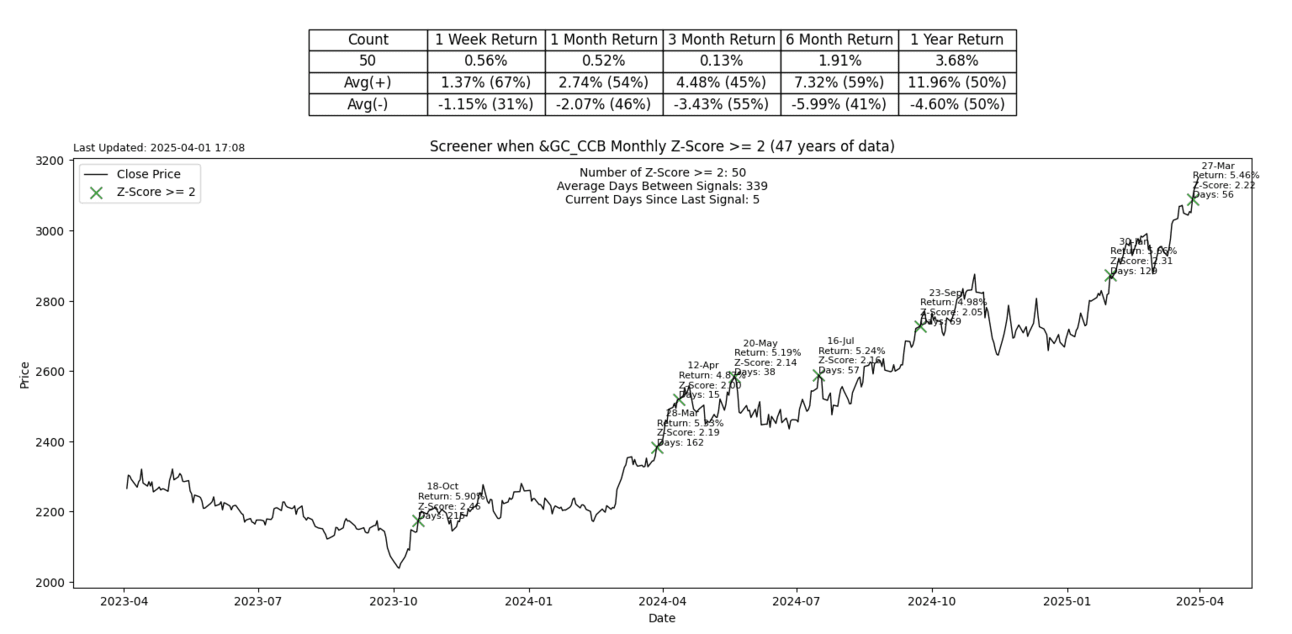
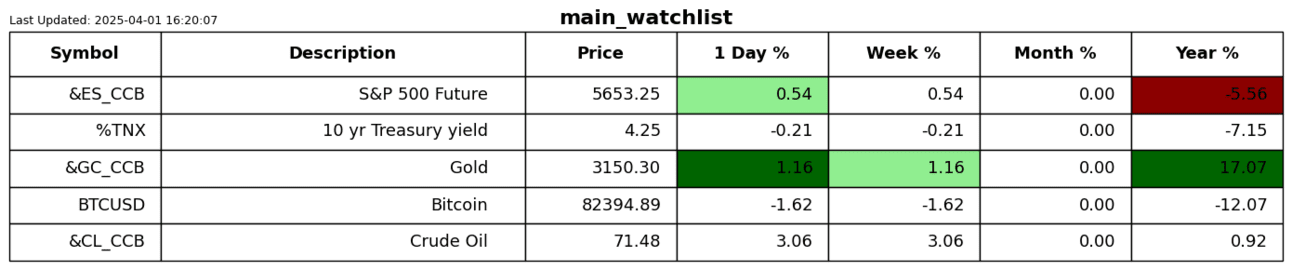
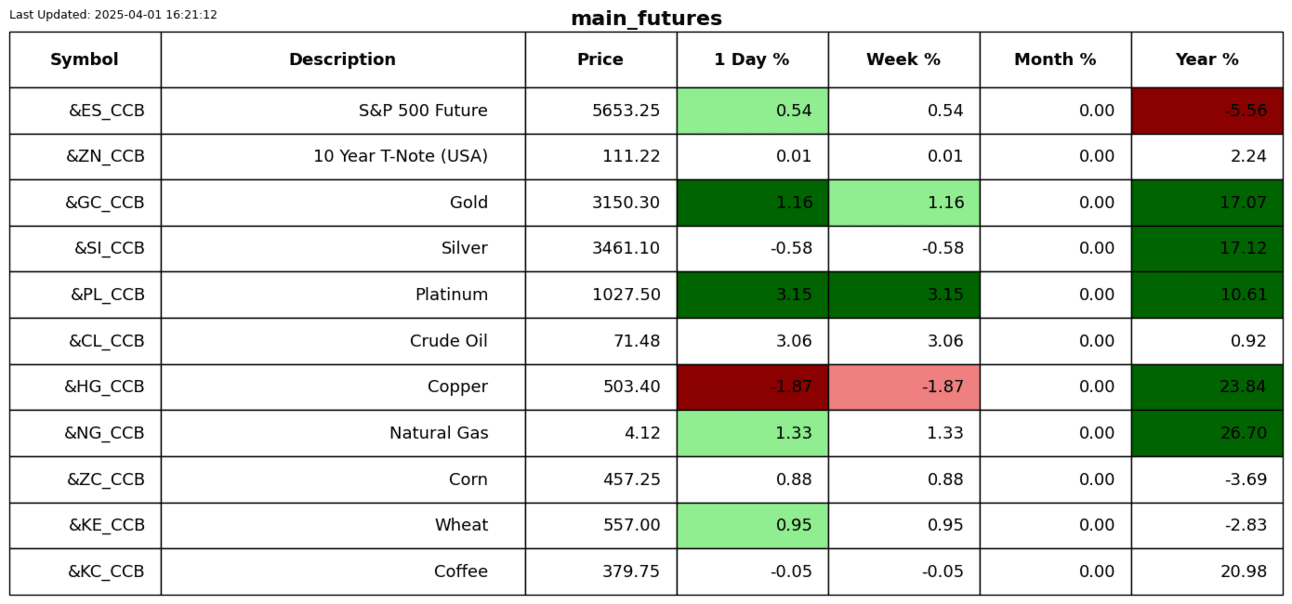
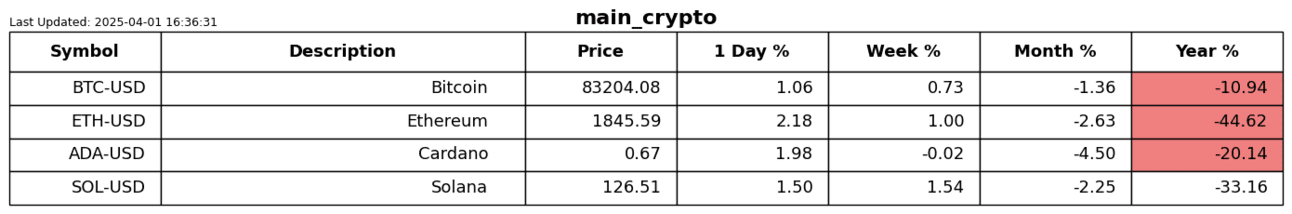
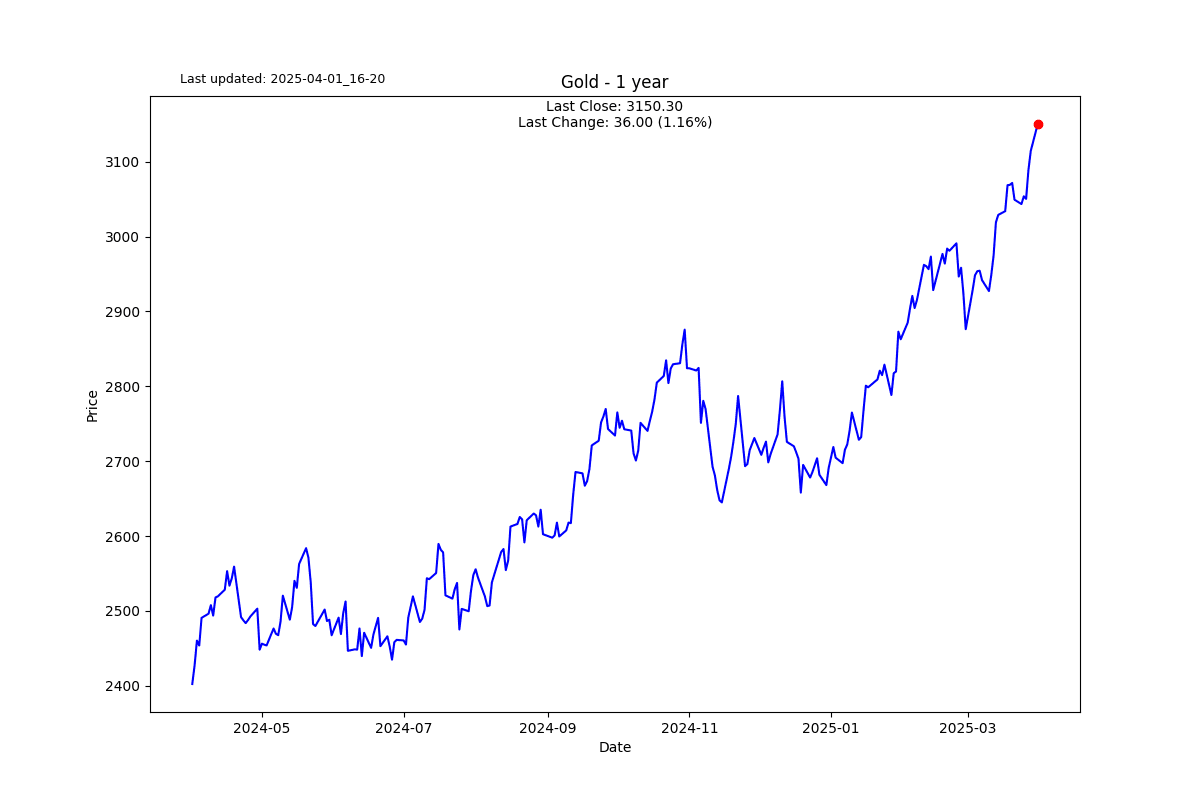
Gold was up 5.46% for the month, which was more than a 2-sigma event, pretty rare.
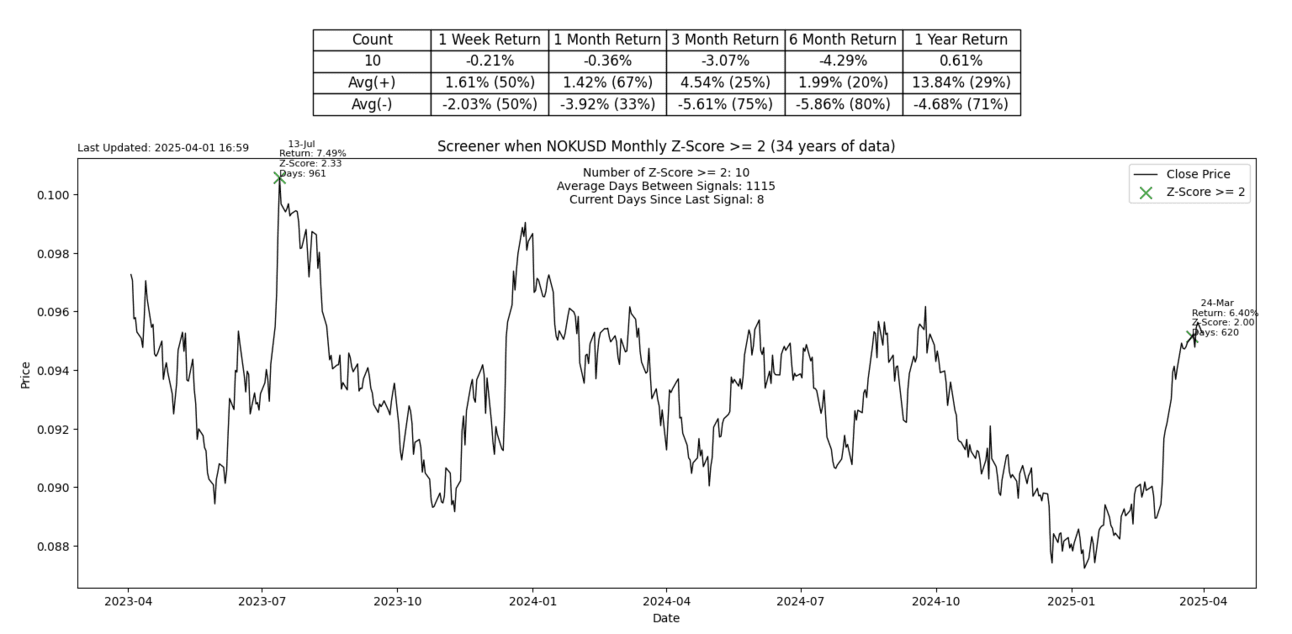
The Norwegian krone weakened by more than 6.4% for the month, a 2-sigma month, only the 10th time in 34 years.
S2N performance review
S2N chart gallery
S2N news today
Author

Michael Berman, PhD
Signal2Noise (S2N) News
Michael has decades of experience as a professional trader, hedge fund manager and incubator of emerging traders.


