Boeing Elliott Wave View: Biggest Pullback Taking Place [Video]
![Boeing Elliott Wave View: Biggest Pullback Taking Place [Video]](https://editorial.fxstreet.com/images/Markets/Equities/Exchange_iStock_000002664244_Medium_XtraLarge.jpg)
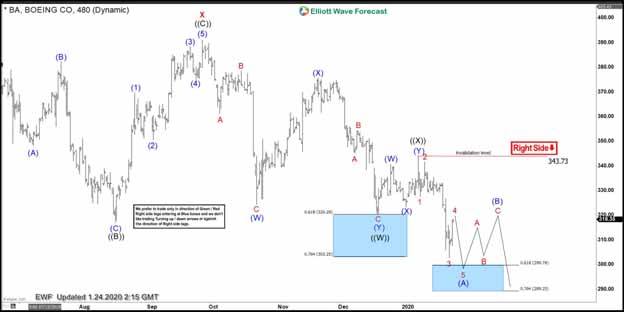
Boeing ticker symbol: $BA is showing an incomplete sequence from March 1, 2019 peak favoring more downside towards $275-$248 target area to the downside. In the chart below, the stock is showing an overlapping price action from September 25, 2019 peak. With each leg down showing sub-division of 3 waves corrective structure. Thus suggesting that the cycle degree y leg lower can be taking place as a double three structure. Therefore, we are taking a more aggressive view by calling wave ((W)) ended at $320.21 low. Wave ((X)) bounce ended at $343.73 high. While wave ((Y)) is in progress as a lesser degree Elliott wave zigzag structure.
Near-term, while bounces fail below $343.73 high the stock is expected to see another push lower towards $299.79-$289.25 area. To end the wave (A) lower in 5 wave structure. Then the stock is expected to do a bounce in wave (B) to correct the cycle from January 7, 2020 peak ( $343.73) in 3 or 7 swings. Before more downside towards $275- $248 area can resume again. We don’t recommend buying the stock at this stage. And prefer selling the bounces in 3 or 7 swings at the extreme areas as far as the pivot from $343.73 high stays intact.
Alternatively, if the pivot from $343.73 high gives up during the next bounce. Then, there’s a possibility that stock could do a bigger bounce against September 25, 2019 peak. In which case, the decline from September 25, 2019 peak to the lows would become 5 waves Leading diagonal structure in wave ((A)) lower. And, we may do a bigger wave ((B)) bounce in 7 or 11 swings before resuming the ((C)) leg lower. However, in any case, more downside is expected to take place either against $343.73 high or against $391 high seen on September 25, 2019 peak.
Boeing 4 Hour Elliott Wave Chart
Boeing Elliott Wave Video
Author

Elliott Wave Forecast Team
ElliottWave-Forecast.com


