Boeing Downs Dow [Video]
![Boeing Downs Dow [Video]](https://editorial.fxstreet.com/images/Markets/Equities/DowJones/dow-jones-industrial-average-on-iphone-4-stocks-app-16978003_XtraLarge.jpg)
US Dollar: June USD is Down at 96.585.
Energies: May '19 Crude is Up at 64.61.
Financials: The Jun 30 year bond is Up 6 ticks and trading at 147.26.
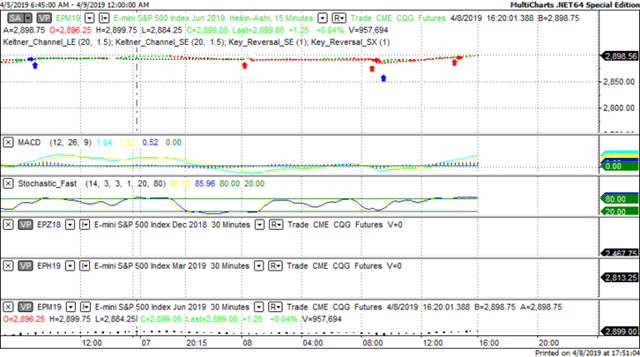
Indices: The June S&P 500 emini ES contract is 15 ticks Lower and trading at 2894.50.
Gold: The April Gold contract is trading Up at 1305.40 Gold is 35 ticks Higher than its close.
Initial Conclusion
This is not a correlated market. The dollar is Down- and Crude is Up+ which is normal but the 30 year Bond is trading Higher. The Financials should always correlate with the US dollar such that if the dollar is lower then bonds should follow and vice-versa. The S&P is Lower and Crude is trading Higher which is correlated. Gold is trading Higher which is correlated with the US dollar trading Up. I tend to believe that Gold has an inverse relationship with the US Dollar as when the US Dollar is down, Gold tends to rise in value and vice-versa. Think of it as a seesaw, when one is up the other should be down. I point this out to you to make you aware that when we don't have a correlated market, it means something is wrong. As traders you need to be aware of this and proceed with your eyes wide open.
At this hour Asia is trading mainly Higher with the exception of the Hang Seng and Sensex exchanges which are fractionally Lower. Currently all of Europe is trading Higher with the exception of the London and German Dax which are fractionally Lower.
Possible Challenges To Traders Today
-
NFIB Small Business Index is out at 6 AM EST. This is major.
-
JOLTS Job Openings is out at 10 AM EST. This is major.
-
IBD/TIPP Economic Optimism - This is major.
Treasuries
We've elected to switch gears a bit and show correlation between the 30 year bond (ZB) and The YM futures contract. The YM contract is the DJIA and the purpose is to show reverse correlation between the two instruments. Remember it's liken to a seesaw, when up goes up the other should go down and vice versa.
Yesterday the ZB made a major move at around 9 AM EST. The ZB hit a High at around that time and the YM hit a Low. If you look at the charts below ZB gave a signal at around 9 AM EST and the YM was moving Higher at the same time. Look at the charts below and you'll see a pattern for both assets. ZB hit a High at around 9 AM and the YM was moving Higher at the same time. These charts represent the newest version of MultiCharts and I've changed the timeframe to a 15 minute chart to display better. This represented a shorting opportunity on the 30 year bond, as a trader you could have netted about 12 ticks per contract on this trade. Each tick is worth $31.25. Please note: the front month for the ZB contract is now June, 2019
Charts Courtesy of MultiCharts built on an AMP platform.
-636903985986434770.png)
Bias
Yesterday we gave the markets a Downside bias as crude, the Bonds and Gold were all trading Higher Monday morning and that's usually indicative of a Downside day. The Dow closer lower by 84 points however the S&P and Nasdaq gained. Today we aren't dealing with a correlated market however our bias is Neutral.
Could this change? Of Course. Remember anything can happen in a volatile market.
Commentary
Yesterday morning the Asian and European markets were both trading Lower and the news was Boeing 737 will remained grounded until June 5th and the markets didn't take that news kindly. To a degree I'm quite surprised that this happened with Boeing as they have historically been very demanding both on themselves and on their subcontractors. A long time ago I worked for Curtiss-Wright who is a major subcontractor of assemblies and components for Boeing. I was a production planner for none other than Boeing 737. Our product was an actuator than controlled the flaps on the plane. I recall that Boeing always had priority within the firm and if an aircraft was ever grounded we would move mountains to get that plane off the ground. What a far cry from today.
Author

Nick Mastrandrea
Market Tea Leaves


