Bitcoin price reached close-to-$20000 levels but could not attack the level. The way BTC/USD is confronting such symbolic price landmarks is quite particular. As opening bearish positions its close to impossible, at least until Bitcoin futures are set and well-incorporated to the market, the technical picture of Bitcoin is very biased.

It's very interesting to observe the three situations that have happened during this past weekend. Our price feed provider offers a chart with some sharp moves, but that can't be seen in every Bitcoin price feed you can check. In the 1-minute chart, we see up to three bearish candles that triggered quick down-swings, and actually one of them reached $10000! The next candle opened at that level and swept any price level in the way up to recovering the previous levels. The fact that the low set by that quick fall rests in a trendline gives it some credibility. 
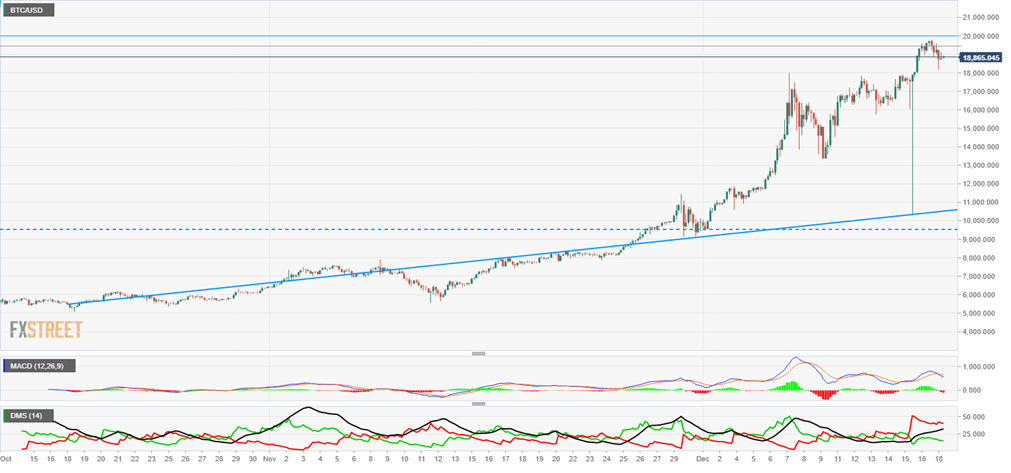
BTC/USD 1H Chart

MACD is resting above the equilibrium line with a bullish setup, so the most probable scenario still remains to favor the upside. A breakout of the trendline would give us a long entry. The fact that the price is so close to $20000 might delay the opening of new bullish positions until that symbolic level gets cleared.

Directional Movement Index shows declining amounts of sellers while buyers increased during the last bearish ride. Money comes and backs the bullish scenario for the next hours. Right now both sides appear to be quite balanced, but that tie could be broken at any moment.

BTC/USD 4H Chart

Bitcoin

In the Bitcoin 4-hour chart, we can see some contradictions with the very-short-term analysis. MACD in this chart shows a structure divergent with the last bullish moves. This kind of setup diminishes the potential for a bullish continuation, contradicts the 1-hour analysis and adds up to a scenario requiring huge amounts of attention from traders.


Directional Movement Index is aligned with what MACD suggests, showing that sellers are in control, with room for a bearish development in Bitcoin price action. In the daily chart, sellers are ahead of buyers by a really small margin.

Conclusion

The technical picture shows contradictions between the short and the mid-term. Bitcoin charts propose more rises as the most probable scenario during the next few hours but with not much chance of holding to those potential bullish moves afterward. That should not be surprising, as it's the $20000 barrier we're talking about here when we still have the $10000 breakout in the short memory.

The arrival of the CME Bitcoin future opens up the door to institutional investors to the BTC/USD market. Regulatory limitations have prevented these big market players to intervene up until now in the biggest cryptocurrency market, but their first takes could bring a lot of money to the table. Moreover, the availability to open net short positions from now on should give Bitcoin a new dimension.

Information on these pages contains forward-looking statements that involve risks and uncertainties. Markets and instruments profiled on this page are for informational purposes only and should not in any way come across as a recommendation to buy or sell in these assets. You should do your own thorough research before making any investment decisions. FXStreet does not in any way guarantee that this information is free from mistakes, errors, or material misstatements. It also does not guarantee that this information is of a timely nature. Investing in Open Markets involves a great deal of risk, including the loss of all or a portion of your investment, as well as emotional distress. All risks, losses and costs associated with investing, including total loss of principal, are your responsibility. The views and opinions expressed in this article are those of the authors and do not necessarily reflect the official policy or position of FXStreet nor its advertisers. The author will not be held responsible for information that is found at the end of links posted on this page.

If not otherwise explicitly mentioned in the body of the article, at the time of writing, the author has no position in any stock mentioned in this article and no business relationship with any company mentioned. The author has not received compensation for writing this article, other than from FXStreet.

FXStreet and the author do not provide personalized recommendations. The author makes no representations as to the accuracy, completeness, or suitability of this information. FXStreet and the author will not be liable for any errors, omissions or any losses, injuries or damages arising from this information and its display or use. Errors and omissions excepted.

The author and FXStreet are not registered investment advisors and nothing in this article is intended to be investment advice.

Recommended Content


Recommended Content

Editors’ Picks

AUD/USD stands firm above 0.6500 with markets bracing for Aussie PPI, US inflation

AUD/USD stands firm above 0.6500 with markets bracing for Aussie PPI, US inflation

The Aussie Dollar begins Friday’s Asian session on the right foot against the Greenback after posting gains of 0.33% on Thursday. The AUD/USD advance was sponsored by a United States report showing the economy is growing below estimates while inflation picked up. The pair traded at 0.6518.

AUD/USD News

EUR/USD mired near 1.0730 after choppy Thursday market session

EUR/USD mired near 1.0730 after choppy Thursday market session

EUR/USD whipsawed somewhat on Thursday, and the pair is heading into Friday's early session near 1.0730 after a back-and-forth session and complicated US data that vexed rate cut hopes.

EUR/USD News

Gold soars as US economic woes and inflation fears grip investors

Gold soars as US economic woes and inflation fears grip investors

Gold prices advanced modestly during Thursday’s North American session, gaining more than 0.5% following the release of crucial economic data from the United States. GDP figures for the first quarter of 2024 missed estimates, increasing speculation that the US Fed could lower borrowing costs.

Gold News

Bitcoin price continues to get rejected from $65K resistance as SEC delays decision on spot BTC ETF options

Bitcoin price continues to get rejected from $65K resistance as SEC delays decision on spot BTC ETF options

Bitcoin (BTC) price has markets in disarray, provoking a broader market crash as it slumped to the $62,000 range on Thursday. Meanwhile, reverberations from spot BTC exchange-traded funds (ETFs) continue to influence the market.

Read more

US economy: Slower growth with stronger inflation

US economy: Slower growth with stronger inflation

The dollar strengthened, and stocks fell after statistical data from the US. The focus was on the preliminary estimate of GDP for the first quarter. Annualised quarterly growth came in at just 1.6%, down from the 2.5% and 3.4% previously forecast.

Read more

Majors

Cryptocurrencies

Signatures